


Just like any other job, forex trading is also a daily grind. Traders need to commit to doing the same routine day in and day out in order to capture the number of trades necessary that should allow the law of large numbers to play out. Although it may sound easy, committing to the same routine is very tedious for many traders. Many would quit right away because they do not see immediate results. What they do not understand is that trading is all about statistics. Traders make money either because of high risk-reward ratios or high win rates.
Trading strategies that rely on high risk-reward ratios may experience some drawdown periods. However, winning trades with high yields often carry their accounts toward the profitable zone.
Trend reversals allow traders to capture huge returns on a few trades. However, it is also not that easy to anticipate trend reversals. Traders who have a knack for trading trend reversals with a relatively high degree of accuracy tend to profit big from the forex market.
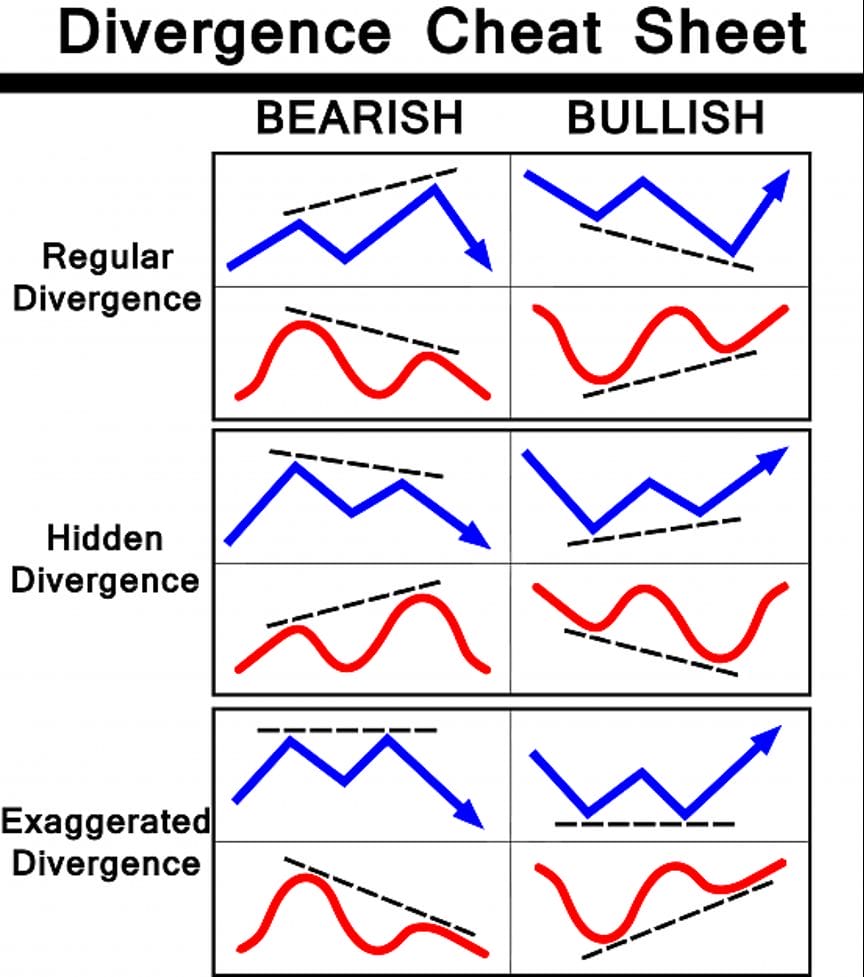
Divergences are scenarios which show differences between the intensity of a swing on the price chart and its corresponding peak or trough on an oscillator. These conditions often indicate that price is about to reverse.
Many traders have reported to been reported to be very accurate trading trend reversals using divergences. Traders who can master divergences using the right indicators can profit so much from the forex market.
Below is a chart showing the different types of divergences.
Moving Average Convergence and Divergence
The Moving Average Convergence and Divergence (MACD) is a classic technical indicator which is widely used by many professional traders. It is an oscillator type of technical indicator which is based on the crossover of moving averages.
The MACD is calculated by subtracting one Exponential Moving Average (EMA) to a slower moving Exponential Moving Average. The difference of the two EMA lines are then potted as an oscillator that could either be positive or negative. This is often called the MACD line. A signal line is then derived from the MACD line. The signal line is a Simple Moving Average (SMA) based on the MACD line.
Trend direction or bias is based on how the two lines overlap. A bullish signal is identified whenever the MACD line crosses above the signal line. Inversely, a bearish signal is identified whenever the MACD line crosses below the signal line.
This version of the MACD plots the MACD line as histogram bars and the signal line as an oscillating line that shadows the movement of the MACD bars.
Trend Signal Indicator
As the name suggests, the Trend Signal indicator is a custom technical indicator which helps traders identify trend reversals and trend direction.
The Trend Signal identifies the direction of the trend and plots an arrow on the price chart indicating the direction of the new trend. It plots an arrow pointing up whenever it detects a bullish trend reversal and an arrow pointing down whenever it detects a bearish trend reversal.
This indicator is mainly used as trend reversal entry signal. Traders use it as a trigger to enter a trend reversal setup. However, it could also be used to identify trend direction bias when trading shorter term momentum trades.
cBB Indicator
The cBB indicator is a custom oscillator type technical indicator. This oscillator is uniquely based on the Bollinger Bands.
The cBB oscillator plots a line that oscillates around its midpoint which is 50.
The line could also drop below zero or breach above 100. Lines breaching above 100 indicate an overbought market, while lines dropping below zero indicate an oversold market. Both conditions are prime for a mean reversal.
Trend direction bias can be observed based on the general location of the line in relation to its midpoint. The trend is bullish if the line is constantly above 50 and bearish if the line is constantly below 50.
Trading Strategy
This trading strategy is a trend reversal trading strategy which trades on divergence setups. It makes use of the cBB indicator as a basis for divergences.
The MACD confirms the reversal based on the crossing over of the MACD bars and the signal line conforming with the direction of the trend reversal.
The Trend Signal indicator also acts as the final confirmation of the trade setup based on the arrow it plots.
Indicators:
- Trend_Signal
- Length: 12
- Risk: 6
- MACD
- Fast EMA: 17
- Slow EMA: 31
- MACD SMA: 14
- cBB
- Band Periods: 36
Preferred Time Frames: 1-hour, 4-hour and daily charts
Currency Pairs: FX majors, minors and crosses
Trading Sessions: Tokyo, London and New York sessions
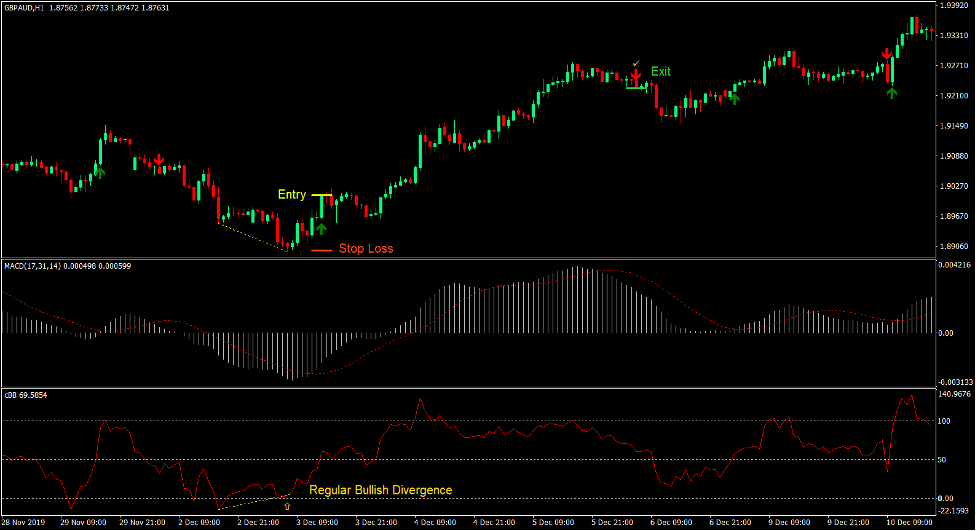
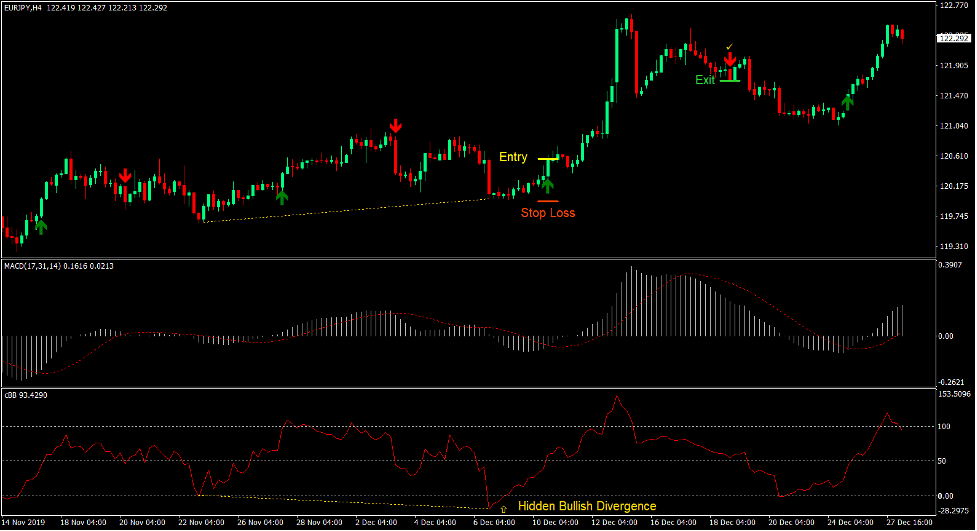
Buy Trade Setup
Entry
- A bullish divergence should be observed between the cBB indicator and price action.
- The MACD histogram bars should cross above the MACD signal line.
- The Trend Signal indicator should plot an arrow pointing up.
- Enter a buy order on the confirmation of these conditions.
Stop Loss
- Set the stop loss on the support below the entry candle.
Exit
- Close the trade as soon as the Trend Signal indicator plots an arrow pointing down.
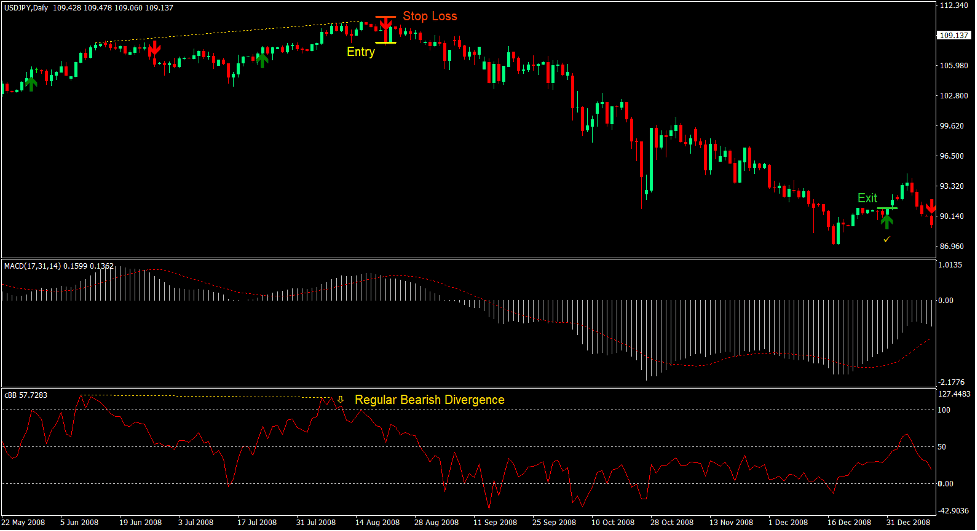
Sell Trade Setup
Entry
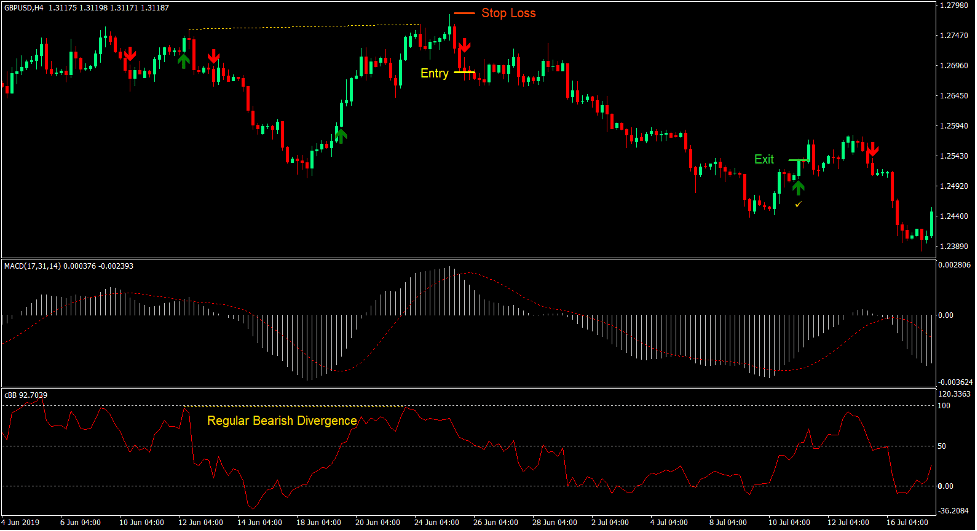
- A bearish divergence should be observed between the cBB indicator and price action.
- The MACD histogram bars should cross below the MACD signal line.
- The Trend Signal indicator should plot an arrow pointing down.
- Enter a sell order on the confirmation of these conditions.
Stop Loss
- Set the stop loss on the resistance above the entry candle.
Exit
- Close the trade as soon as the Trend Signal indicator plots an arrow pointing up.
Conclusion
Divergences are some of the most accurate type of trend reversal signal. In fact, many professional traders have consistently profited from the forex market trading divergences exclusively.
The key to trading divergences successfully is in identifying the general direction of the longer-term trend and not trading against it. Some traders would zoom out to a higher timeframe in order to identify the long-term trend and trade only in that direction.
Then, it would all boil down to identifying the right divergence setups. Traders who could identify high probability divergences tend to consistently profit from the market by trading high yielding setups with a relatively high degree of win probability.
Recommended MT4 Brokers
XM Broker
- Free $50 To Start Trading Instantly! (Withdraw-able Profit)
- Deposit Bonus up to $5,000
- Unlimited Loyalty Program
- Award Winning Forex Broker
- Additional Exclusive Bonuses Throughout The Year

>> Sign Up for XM Broker Account here <<
FBS Broker
- Trade 100 Bonus: Free $100 to kickstart your trading journey!
- 100% Deposit Bonus: Double your deposit up to $10,000 and trade with enhanced capital.
- Leverage up to 1:3000: Maximizing potential profits with one of the highest leverage options available.
- ‘Best Customer Service Broker Asia’ Award: Recognized excellence in customer support and service.
- Seasonal Promotions: Enjoy a variety of exclusive bonuses and promotional offers all year round.

>> Sign Up for FBS Broker Account here <<
Click here below to download: