


Price Action, one of the most widely used terms in trading, yet different traders have different descriptions of it. Some suggest that it is an analysis of the basic movements of price which generate entry and exit signals and that it stands out for not requiring the use of indicators. Some traders identify it as the movements of a security’s price plotted over time. These descriptions may be clear to some traders, yet it could also be very vague to some.
Personally, I would describe price action as the characteristics of price movements plotted on a price chart which could help indicate trend direction, momentum, reversals, continuations and many other market scenarios that could occur. This may be vague yet if you would scrutinize each one of these conditions, you would see price action characteristics that could help us identify each. For example, uptrends could be identified based on rising swing highs and swing lows, while downtrends can be identified by a constant drop of the swing points. Momentum can be identified based on full-bodied long candles pushing in one direction. Reversals can be identified based on price rejection characteristics such as wicks pushing against a price level. Continuations can be identified by a sudden push in the direction of the trend right after a retracement or contraction.
Here, we will be looking at a trend continuation scenario in which entries are identified based on price rejections. Pure price action traders may also argue that price action requires the use of naked charts. However, no rule is stopping us from using a few technical indicators to aid us in identifying a good trade setup.
HAMA
HAMA, Heiken Ashi Moving Average, or Heiken Ashi Smoothed, they can be used interchangeably. HAMA is a trend following technical indicator which excels in helping traders clearly identify trend direction. It is characteristically very responsive to price action movements, while at the same time it is not too fickle to easily produce false signals.
HAMA is an offshoot or derivative of the Heiken Ashi Candlesticks and a basic Exponential Moving Average (EMA) line. It produces bars that changes color to indicate the direction of the trend, while at the same time it plots these bars with the same responsiveness as the EMA line.
Heiken Ashi in Japanese literally means average bars. In a sense, this is what the HAMA does. It averages out historical price data. The resulting computation is then plotted as bars overlaid on the price chart. The color of the bars change depending on the direction of the trend. Blue bars indicate a bullish trend while red bars indicate a bearish trend. Consequently, color changes could indicate a potential trend reversal.
RAVI
RAVI basically stands for Range Action Verification Index. This indicator represents the relative convergence or divergence of an underlying moving average of a tradeable instrument, increased a hundred time. The based RAVI configuration is based on an underlying 13-period Simple Moving Average (SMA). It was originally based on a 13-week period which is equivalent to a 3-month period. However, given the technology and speed of trading nowadays, it can also be applied on the lower timeframes.
The RAVI indicator is an oscillator type of technical indicator. It plots bars that oscillate around its midline, zero. Positive bars indicate a bullish trend bias, while negative bars indicate a bearish trend bias.
The strengthening of a trend momentum can also be identified based on the color of the bars. Green bars indicate a strengthening bullish trend, while red bars indicate a strengthening bearish trend. Grey bars on the other hand indicate a neutral momentum whether bullish or bearish.
Traders can use this indicator as a trend reversal entry signal based on the shifting of the bars. It can also be used as a trend direction filter to help traders avoid trading against the trend.
Trading Strategy
RAVI HAMA Push Forex Trading Strategy trades with the direction of an existing trend using price rejection as the main entry signal.
First, trend direction is identified based on the color of the HAMA bars. Such trend direction is then confirmed based on the rising or dropping swing point pattern of price action. The RAVI bars should also confirm the trend direction based on whether the bars are generally positive or negative. Trades are taken exclusively in the direction of the trend.
As soon as we isolate the trend and trade direction, we then wait for price to retrace towards the area of the HAMA bars. Price action should show signs of price rejection as it nears or touches the HAMA bars. This is based on wicks pushing against the HAMA bars. This would be our entry signal.
Indicators:
- HAMA_
- Ravisignal
Preferred Time Frames: 30-minute, 1-hour, 4-hour and daily charts
Currency Pairs: FX majors, minors and crosses
Trading Sessions: Tokyo, London and New York sessions
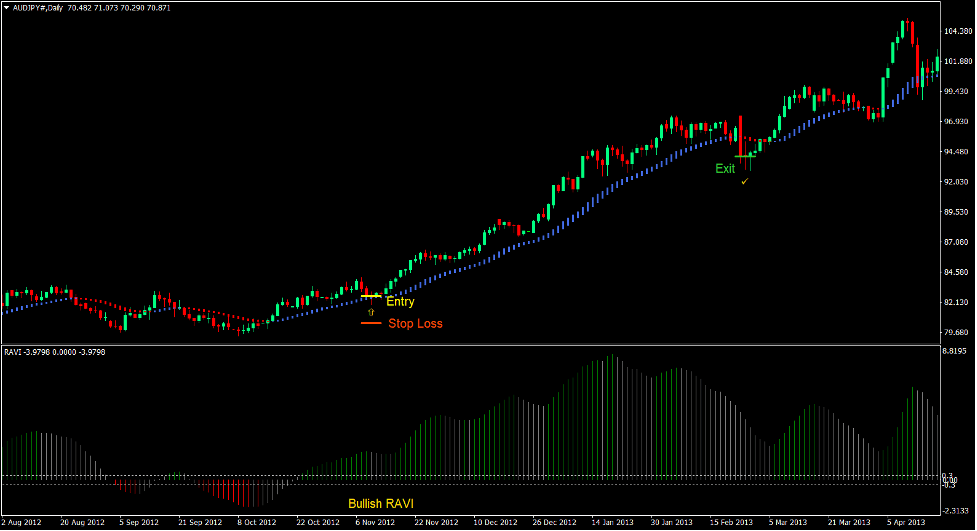
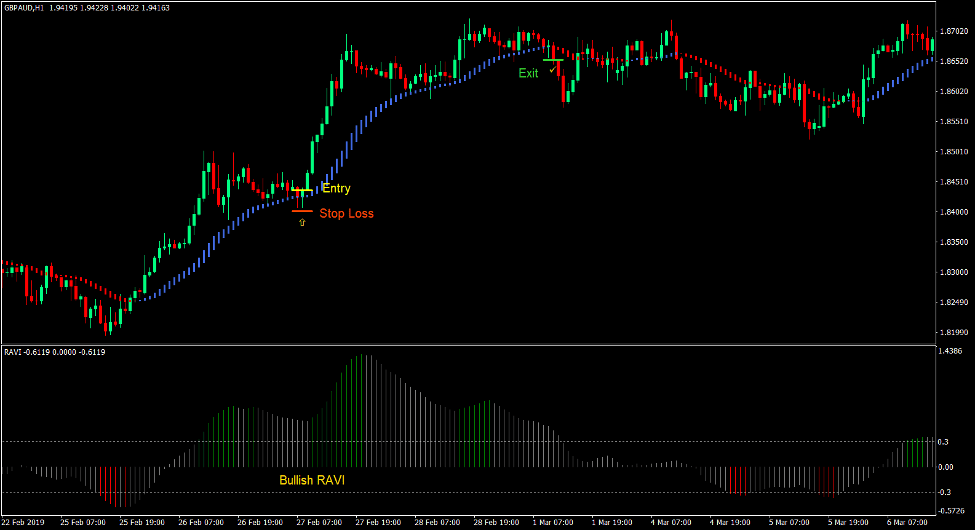
Buy Trade Setup
Entry
- The HAMA bars should be blue.
- The swing highs and swing lows should be rising.
- The RAVI bars should be positive.
- Price should retrace towards the HAMA bars.
- Price should reject the HAMA bars price level indicated by wicks pushing against it.
- Enter a buy order on the confirmation of the conditions above.
Stop Loss
- Set the stop loss on the support below the entry candle.
- Set the stop loss below the HAMA bars.
Exit
- Close the trade as soon as the HAMA bars change to red.
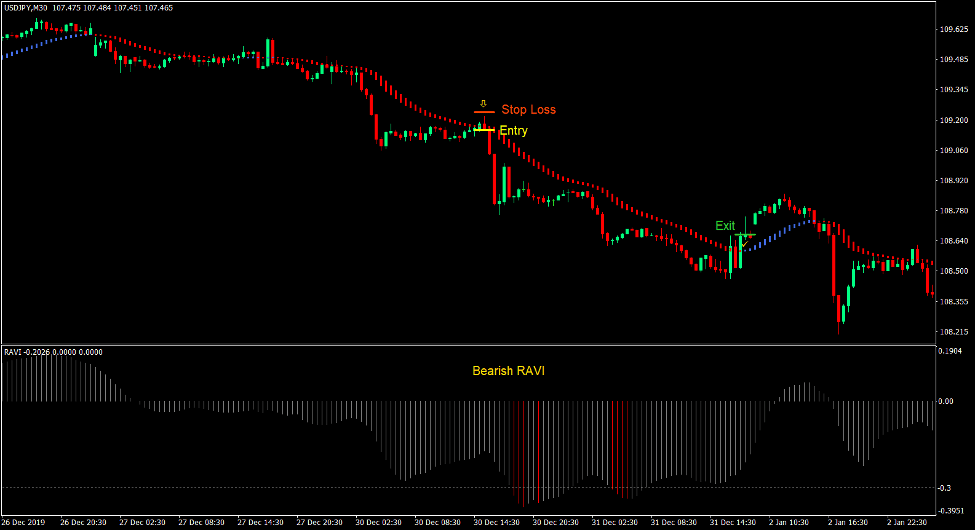
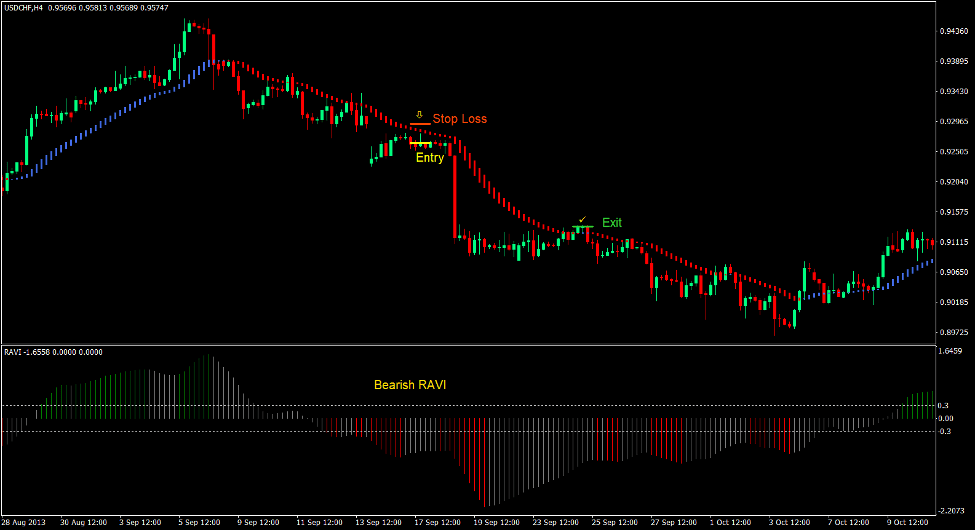
Sell Trade Setup
Entry
- The HAMA bars should be red.
- The swing highs and swing lows should be dropping.
- The RAVI bars should be negative.
- Price should retrace towards the HAMA bars.
- Price should reject the HAMA bars price level indicated by wicks pushing against it.
- Enter a sell order on the confirmation of the conditions above.
Stop Loss
- Set the stop loss on the resistance above the entry candle.
- Set the stop loss above the HAMA bars.
Exit
- Close the trade as soon as the HAMA bars change to blue.
Conclusion
This trading strategy is a basic trend following and trend continuation strategy, which incorporates price rejection in order to identify specific entry points. This allows us as traders to enter at a better price rather than being too late to enter a trend.
This strategy can produce consistent profits when used in the right trending market condition.
Recommended MT4 Brokers
XM Broker
- Free $50 To Start Trading Instantly! (Withdraw-able Profit)
- Deposit Bonus up to $5,000
- Unlimited Loyalty Program
- Award Winning Forex Broker
- Additional Exclusive Bonuses Throughout The Year

>> Sign Up for XM Broker Account here <<
FBS Broker
- Trade 100 Bonus: Free $100 to kickstart your trading journey!
- 100% Deposit Bonus: Double your deposit up to $10,000 and trade with enhanced capital.
- Leverage up to 1:3000: Maximizing potential profits with one of the highest leverage options available.
- ‘Best Customer Service Broker Asia’ Award: Recognized excellence in customer support and service.
- Seasonal Promotions: Enjoy a variety of exclusive bonuses and promotional offers all year round.

>> Sign Up for FBS Broker Account here <<
Click here below to download: