


Momentum reversals are excellent trading opportunities. However, it is often difficult to anticipate market reversals as this would mean going against the current flow of the market momentum. One way traders anticipate probable market reversals is by looking for divergences.
The trading strategy to be discussed below shows us a simplified method for identifying divergences using the OsMA Indicator and the Zigzag Int Indicator.
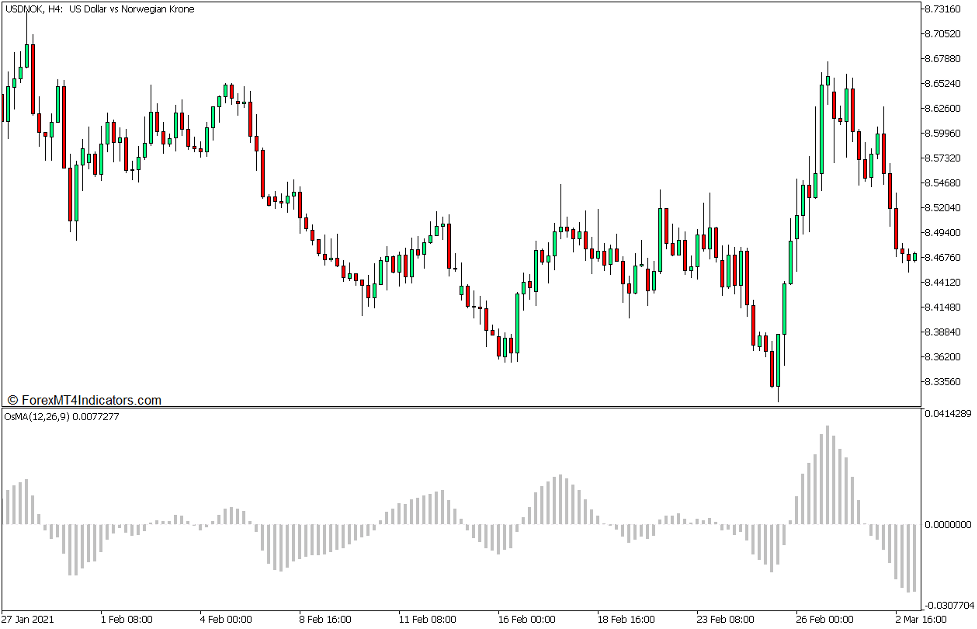
Moving Average of Oscillator Indicator
The Moving Average of Oscillator Indicator or Oscillator of Moving Averages (OsMA) is a momentum indicator which is derived from an underlying oscillator. As the name suggests, it calculates for the Moving Average (MA) of its underlying oscillator indicator.
The most common oscillator that is used within the OsMA is the Moving Average Convergence and Divergence (MACD). However, other version of the OsMA have also employed different types of oscillators within its program to come up with an OsMA indicator that could work for different markets.
The concept behind the OsMA indicator is pretty simple. It is basically programmed to calculate for the moving average of its underlying oscillator. Then, it subtracts the value of the moving average from the oscillator. The resulting difference is then used to plot the OsMA’s histogram bars or oscillator line.
The OsMA Indicator used in this strategy is based on the MACD. It calculates for the two Exponential Moving Averages (EMA), the difference of which is used as the value for its underlying MACD. Then, it further computes for the Simple Moving Average (SMA) of the value which is derived from the MACD. Finally, the OsMA indicator calculates for the difference between the MACD value and the SMA value. The resulting value is then used to plot the histogram bars of the OsMA indicator.
This OsMA Indicator plots histogram bars to present the oscillations of the market. These bars oscillate around zero. Positive bars indicate that the market is in a bullish bias, while negative bars indicate that the market is in a bearish bias.
Momentum swings can also be anticipated based on the rising or falling of the OsMA value. A series of rising OsMA values, whether positive or negative, indicate that the market is gaining a bullish momentum. Inversely, dropping OsMA values indicate a possible bearish momentum swing.
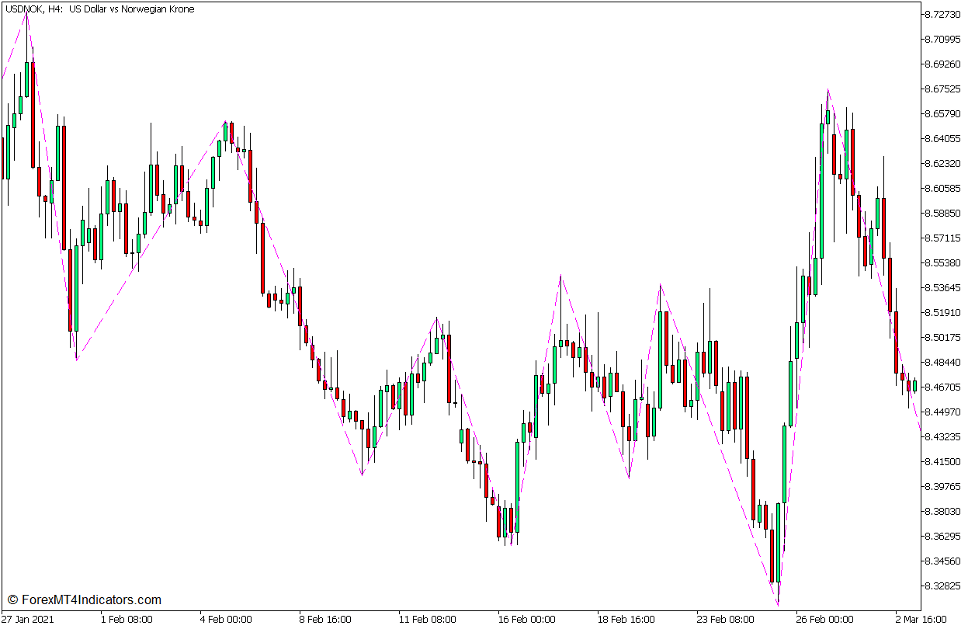
Zigzag Int Indicator
The Zigzag Int Indicator is a custom technical indicator which is a version of the Zigzag Indicator. It is an indicator which was developed to help traders identify swing highs and swing lows by plotting lines that connect one swing point to another.
This indicator uses an algorithm which identifies swing highs and swing lows by calculating for the deviation of price movements from the previous momentum direction. It has a deviation threshold which would trigger the indicator to detect a new momentum swing direction whenever breached. This deviation threshold is usually preset at 5%. If price action moves against the current momentum direction above this threshold, the indicator would detect a new momentum direction and would try to detect the new swing point. As soon as it detects the new swing point, it would plot a line connecting the previous swing point to the new swing point. The indictor would repeat the same process continuously plotting lines moving up whenever a swing high is detected, and lines moving down whenever a swing low is detected, creating a zigzag pattern, thus the name Zigzag Indicator.
This version of the Zigzag Indicator plots a blue dashed line connecting the swing highs and swing lows. Traders can use the identified swing points to easily make sense of the trajectory of price action, support and resistance levels, and order blocks.
Trading Strategy Concept
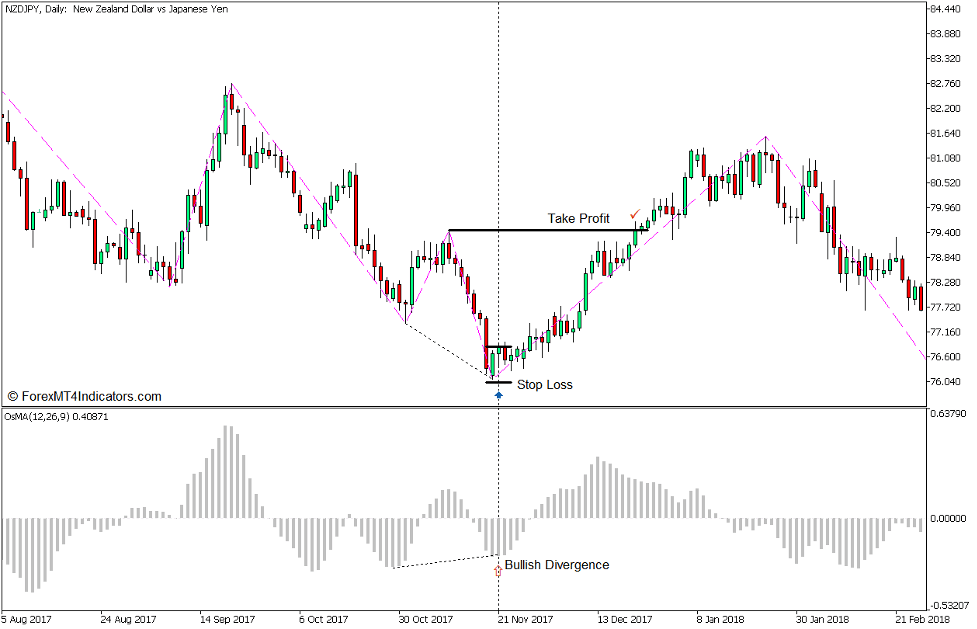
OsMA and Zigzag INT Divergence Forex Trading Strategy for MT5 is a reversal trading strategy which trades divergences using the Zigzag Int Indicator and the OsMA Indicator.
The Zigzag Int Indicator is used to help traders easily identify valid swing highs and swing lows. The identified swing highs and swing lows are then compared to the corresponding peaks and dips on the OsMA chart. From there we could start observing if price action is forming a divergence when compared with the OsMA bars.
If there is a valid divergence, we could then observe the characteristics of the candlesticks if it is rejecting the level and is starting to reverse. This can be identified through candlestick patterns, candle color change, and weakening momentum. The reversal is confirmed by the changing of the trajectory of the OsMA bars, either from increasing to decreasing values, or vice versa.
Buy Trade Setup
Entry
- Identify the valid swing lows as indicated by the Zigzag Int Indicator.
- Compare the swing lows with the dips of the OsMA bars and note if there is valid bullish divergence.
- Observe price action if it is indicating a probable bullish reversal.
- Open a buy order as soon as the OsMA bar values start to increase.
Stop Loss
- Set the stop loss on the fractal below the entry candle.
Exit
- Set the take profit target on the most recent swing high.
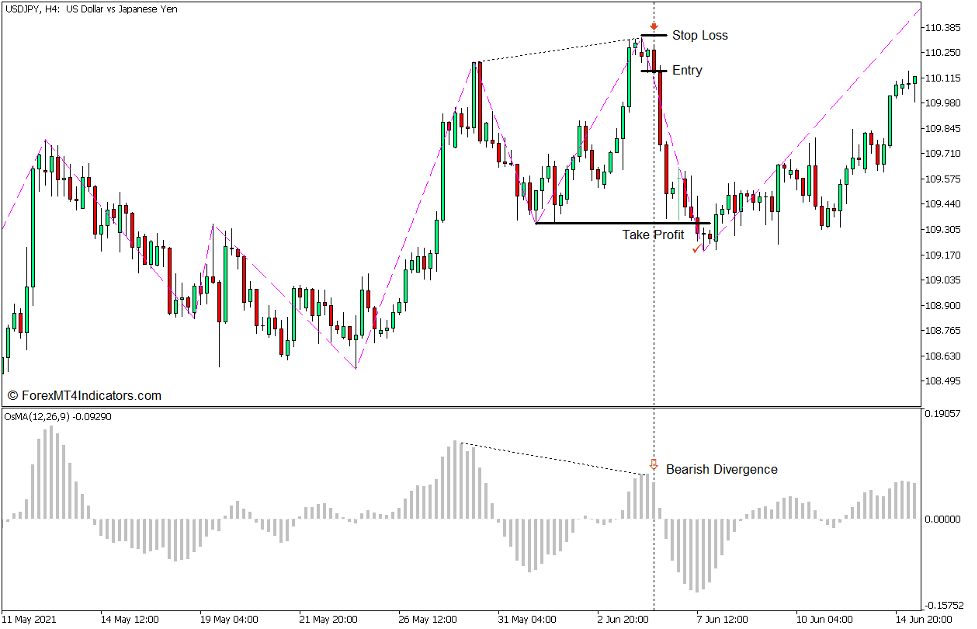
Sell Trade Setup
Entry
- Identify the valid swing highs as indicated by the Zigzag Int Indicator.
- Compare the swing highs with the peaks of the OsMA bars and note if there is valid bearish divergence.
- Observe price action if it is indicating a probable bearish reversal.
- Open a sell order as soon as the OsMA bar values start to decrease.
Stop Loss
- Set the stop loss on the fractal above the entry candle.
Exit
- Set the take profit target on the most recent swing low.
Conclusion
Divergences can be very effective indications of a probable reversal. In fact, there are many professional traders who use divergences as their main basis for considering a probable market reversal.
However, trading based on divergences also require traders to be proficient in identifying swing highs and swing lows. This trading strategy simply shows us a simplified method on how to identify swing highs and swing lows objectively using the Zigzag Int Indicator, allowing us to use the swing points as a basis for identifying potential divergences.
Recommended MT5 Brokers
XM Broker
- Free $50 To Start Trading Instantly! (Withdraw-able Profit)
- Deposit Bonus up to $5,000
- Unlimited Loyalty Program
- Award Winning Forex Broker
- Additional Exclusive Bonuses Throughout The Year

>> Sign Up for XM Broker Account here <<
FBS Broker
- Trade 100 Bonus: Free $100 to kickstart your trading journey!
- 100% Deposit Bonus: Double your deposit up to $10,000 and trade with enhanced capital.
- Leverage up to 1:3000: Maximizing potential profits with one of the highest leverage options available.
- ‘Best Customer Service Broker Asia’ Award: Recognized excellence in customer support and service.
- Seasonal Promotions: Enjoy a variety of exclusive bonuses and promotional offers all year round.

>> Sign Up for FBS Broker Account here <<
Click here below to download: