


Introduction to the MACD Histogram Multi Timeframe Multi Color Indicator
Seasoned traders know how important it is to trade based on the confluence of multiple timeframes. This is because trading based such confluences allow for trade setups which have significantly higher win probabilities compared to trade signals with no confluences. This indicator allows users to analyze momentum based on multiple timeframes using a MACD oscillator.
What is the MACD Histogram Multi Timeframe Multi Color Indicator?
The MACD Histogram Multi Timeframe Multi Color Indicator is a momentum oscillator which is a modified version of the classic Moving Average Convergence and Divergence (MACD) Indicator.
This indicator modifies the MACD by having the option to calculate the MACD values based on a different timeframe.
This indicator plots a blue line, which is the MACD Line, and red line, which is the Signal Line. It also plots histogram bars which change color.
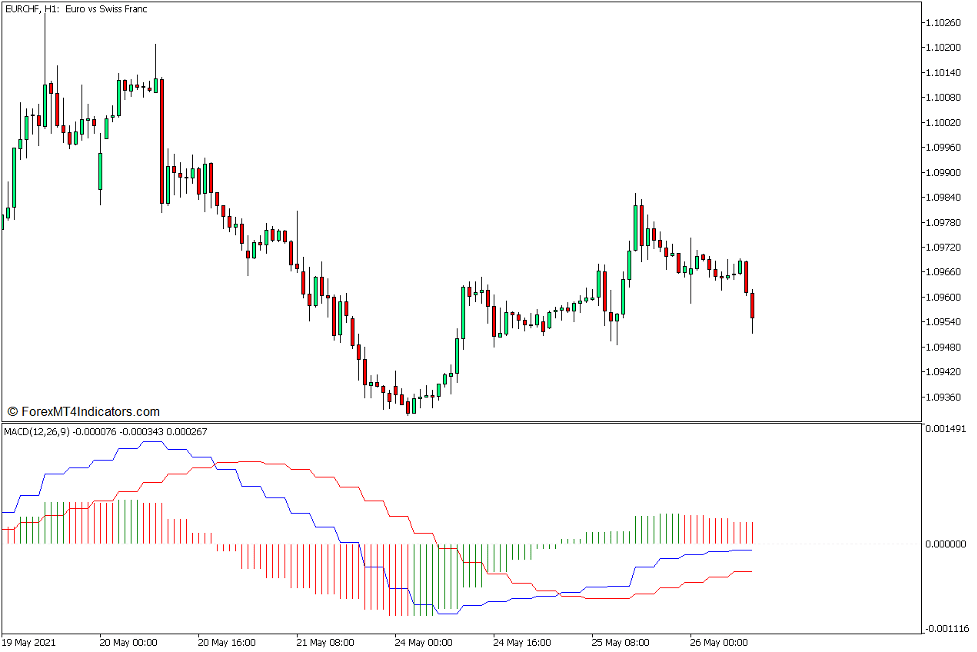
This oscillator indicates a bullish momentum direction whenever the MACD Line is above the Signal Line and the bars are positive. Inversely, it also indicates a bearish momentum whenever the MACD Line is below the Signal Line and the bars are negative.
Green bars also indicate a bullish momentum direction, while red bars indicate a bearish momentum direction.
How the MACD Histogram Multi Timeframe Multi Color Indicator Works?
The MACD Histogram Multi Timeframe Multi Color Indicator has an algorithm which calculates for the MACD Line based on the timeframe chosen by the user. Just like the standard MACD, it has two underlying Exponential Moving Average (EMA) with one faster than the other. It calculates for the difference between the two and its resulting value would be a point on the MACD Line. It then calculates for the Signal Line, which is a Simple Moving Average (SMA) derived from the MACD Line.
The histogram bars are basically the difference between the MACD Line and the Signal Line. The indicator plots green bars whenever the value of the current bar is higher than the previous bar, and red bars if the value of the current bar is lower than the previous bar.
How to use the MACD Histogram Multi Timeframe Multi Color Indicator for MT5
The MACD Histogram Multi Timeframe Multi Color Indicator has several modifiable options within its settings.

“Timeframe 2” allows users to select the timeframe in which the indicator is based on.
“Fast EMA period” and “Slow EMA period” modifies the number of periods which the indicator uses for its underlying EMA lines.
“Singal MA period” modifies the number of periods used to calculate for the Signal Line.
“Applied MA method for signal line” allows users to modify the moving average type used for the Signal Line.
If the indicator does not display properly, modify the “Timeframe 2” option preferably on a higher timeframe.
MACD Histogram Multi Timeframe Multi Color Indicator as a Trade Direction Filter
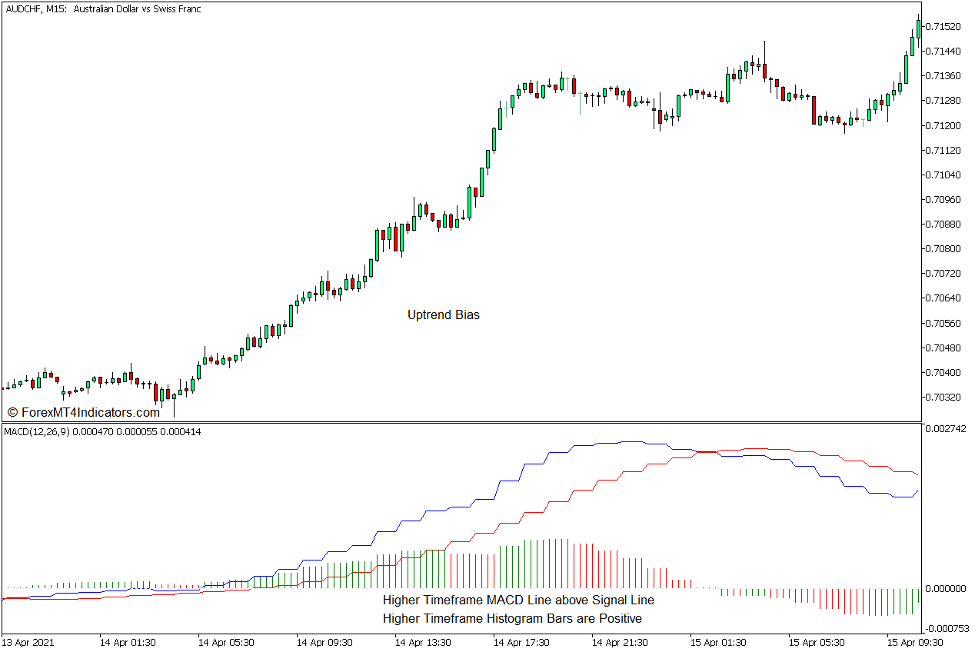
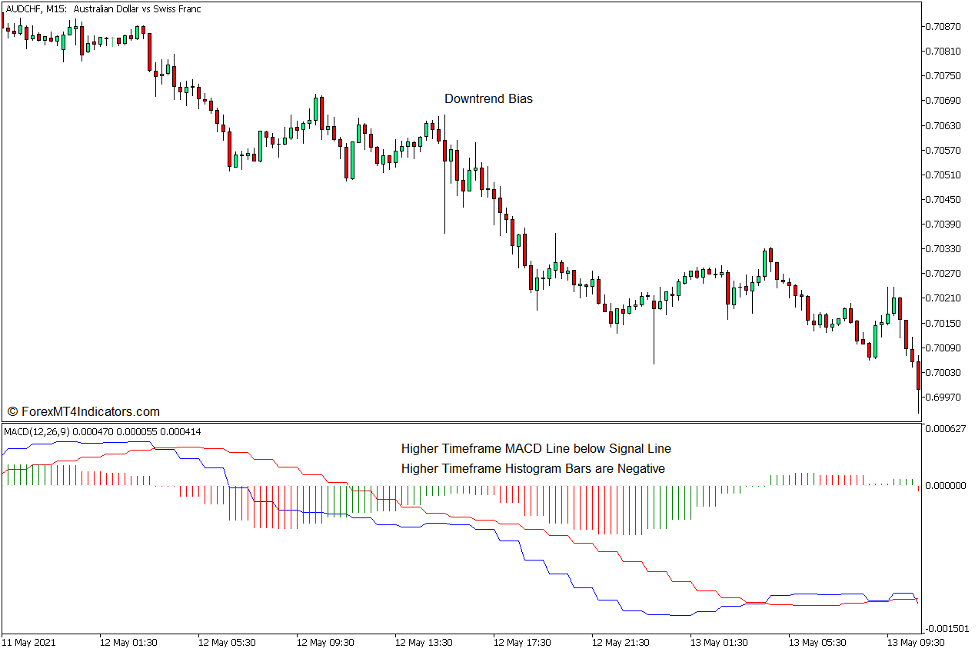
This indicator is best used as a trend direction filter. Traders may identify the direction of the higher timeframe trend or momentum and trade exclusively in the direction indicated by the oscillator.
Below are charts showing markets with an uptrend and downtrend momentum as indicated by the higher timeframe MACD values.
Conclusion
This indicator can be a very useful multi timeframe indicator. Traders can have higher probability trades simply by trading in the direction of the higher timeframe momentum as indicated by this oscillator. However, the precise trade entries should still be based on other technical analysis indications.
Recommended MT5 Brokers
XM Broker
- Free $50 To Start Trading Instantly! (Withdraw-able Profit)
- Deposit Bonus up to $5,000
- Unlimited Loyalty Program
- Award Winning Forex Broker
- Additional Exclusive Bonuses Throughout The Year

>> Sign Up for XM Broker Account here <<
FBS Broker
- Trade 100 Bonus: Free $100 to kickstart your trading journey!
- 100% Deposit Bonus: Double your deposit up to $10,000 and trade with enhanced capital.
- Leverage up to 1:3000: Maximizing potential profits with one of the highest leverage options available.
- ‘Best Customer Service Broker Asia’ Award: Recognized excellence in customer support and service.
- Seasonal Promotions: Enjoy a variety of exclusive bonuses and promotional offers all year round.

>> Sign Up for FBS Broker Account here <<

(Free MT5 Indicators Download)
Click here below to download:
MACD Histogram Multi Timeframe Multi Color Indicator for MT5