


Trading does not necessarily need to be complex. Many traders have this belief that the more complex a trading strategy is, the more likely it is to produce good results. However, this does not necessarily follow. Some traders do well with complex strategies while others are better off using simple strategies. At times, the complexity of the strategy contributes more to the detriment of the trader. It could cause traders to overthink and avoid taking trades or take trades a bit too late. It could also filter out many good trading opportunities causing traders to take boredom trades after seeing many good opportunities pass by. On the other hand, simple strategies have the advantage of not being too overbearing for traders. Traders could quickly make decisions and take good trade setups.
Crossover strategies are some of the simplest types of trading strategies. It is so simple, even beginner traders could quickly adapt to it. Crossover strategies are not the Holy Grail of trading. It is not perfect. However, with the right setup, used in the right market condition and in the right hands, crossover strategies could produce some of the highest yielding trade setups.
MA Octopus Crossover Forex Trading Strategy is a strategy that could produce high yielding trade setups with high reward-risk ratios. It produces trades on mid-term trend reversals as price is beginning to trend to the other direction and exits the trade as the market reverses back. This allows traders to squeeze as much pips out of the trade whenever the market starts to reverse and trend.
MA Trading Signals
MA Trading Signals is a custom technical indicator which helps traders identify trend reversal points. As the name suggests, this indicator provides entry signals using a variety of moving averages.
This indicator has parameters which would allow traders to tweak the length of each underlying moving average, the type of moving averages used, and the type of price data points used.
The indicator then prints arrows indicating the point where the market might reverse and start to trend in the opposite direction. Bullish signals are indicated by an upward pointing lime green arrow, while bearish signals are indicated by a downward pointing red arrow.
Octopus Indicator
The Octopus Indicator is a trend filter indicator which helps traders identify the general trend direction. It is a simple indicator which is binary in nature. It produces either a bullish indication or a bearish indication, nothing in between.
The indicator provides its reading of trend direction using bars. The bars change color depending on the direction of the trend. Green bars indicate a bullish trend while red bars indicate a bearish trend.
The indicator could be used primarily as a trend filter indicator. This means traders could use it to identify which direction to trade. However, it could also be used as an entry signal indicator. This could be based on the changing of the color of the bars. However, it should still be used in confluence with other indicators to produce higher probability trade entries.
Trading Strategy
This trading strategy is a simple crossover strategy using the crossover of the underlying moving averages of the MA Trading Signals indicator and the crossover of price and the 50-period Simple Moving Average (SMA). This provides a confluence of crossover signals which have a higher probability of a winning trade compared to other crossover entries. To do this, we wait for price to crossover the 50 SMA line and for the MA Trading Signals indicator to plot an arrow pointing the direction of the crossover.
However, we should not be taking every trade signal that is presented to us. This strategy uses the Octopus indicator to identify if the general trend direction has already shifted. This means that the Octopus indicator should also the color of its bars. These trend reversal signals should be closely aligned.
Indicators:
- MATradingSignals
- FastMA_Period: 15
- SlowMA_Period: 30
- 50 SMA (Green)
- octopus_1 (default setting)
Currency Pairs: major and minor pairs
Preferred Time Frames: 15-minute, 30-minute, 1-hour and 4-hour charts
Trading Sessions: Tokyo, London and New York sessions
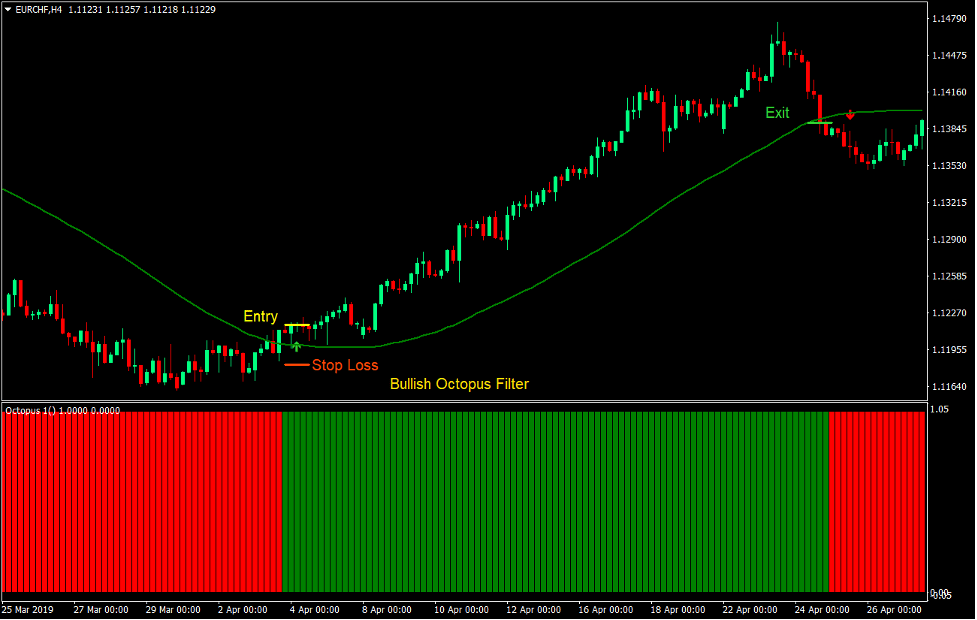
Buy Trade Setup
Entry
- The Octopus indicator bars should change to green.
- Price should cross above the 50 SMA line.
- The MA Trading Signals indicator should print an arrow pointing up.
- These bullish signals should be closely aligned.
- Enter a buy order on the confirmation of these conditions.
Stop Loss
- Set the stop loss on the fractal below the entry candle.
Exit
- Close the trade as soon as the Octopus indicator bars change to red.
- Close the trade as soon as price closes below the 50 SMA line.
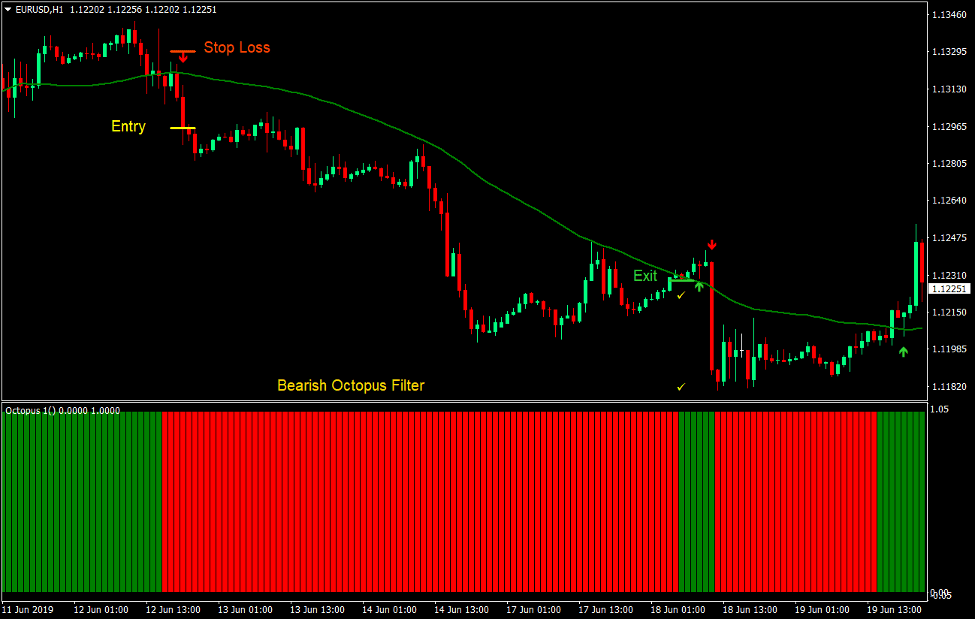
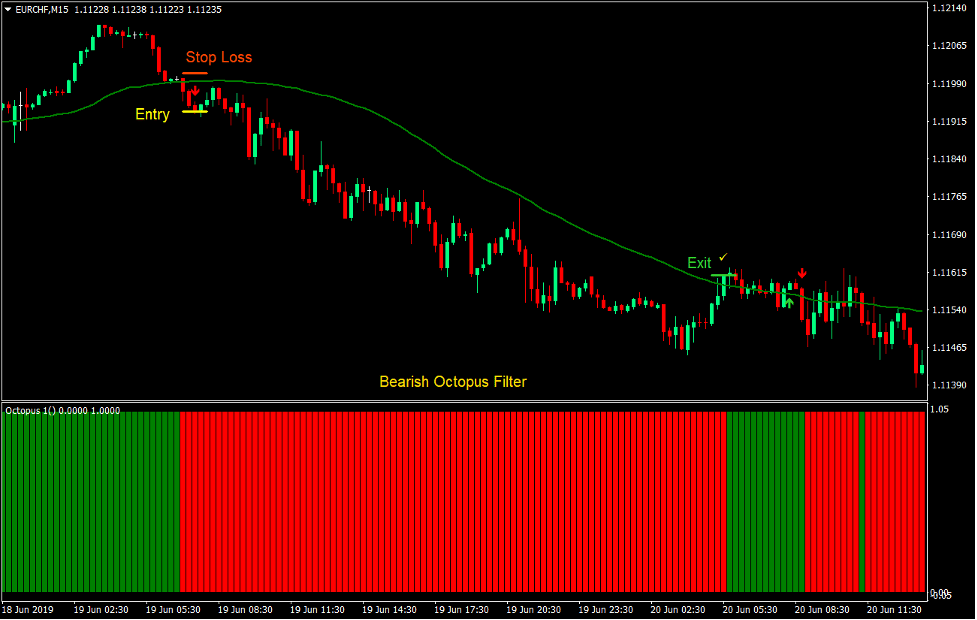
Sell Trade Setup
Entry
- The Octopus indicator bars should change to red.
- Price should cross below the 50 SMA line.
- The MA Trading Signals indicator should print an arrow pointing down.
- These bearish signals should be closely aligned.
- Enter a sell order on the confirmation of these conditions.
Stop Loss
- Set the stop loss on the fractal above the entry candle.
Exit
- Close the trade as soon as the Octopus indicator bars change to green.
- Close the trade as soon as price closes above the 50 SMA line.
Conclusion
Most crossover strategies are not high probability trade setups. However, crossover strategies could produce high yielding trades. These high yielding trades could easily cover for the small losses and provide good returns. This is the reason why despite having a relatively lower probability, crossover strategies are still very profitable.
This strategy manages to increase the probability of a winning trade compared to other crossover strategies. This gives us a decent win rate with the potential of having high yielding trades every now and then.
Another way to improve the win rate of this strategy is to wait for the retest of the 50 SMA line. If price retests the 50 SMA line then continues the direction of the reversal, this will be a confirmation that price is about to start a new trend. Traders who could time the retest and confirmation tend to have higher probability trades.
Recommended MT4 Brokers
XM Broker
- Free $50 To Start Trading Instantly! (Withdraw-able Profit)
- Deposit Bonus up to $5,000
- Unlimited Loyalty Program
- Award Winning Forex Broker
- Additional Exclusive Bonuses Throughout The Year

>> Sign Up for XM Broker Account here <<
FBS Broker
- Trade 100 Bonus: Free $100 to kickstart your trading journey!
- 100% Deposit Bonus: Double your deposit up to $10,000 and trade with enhanced capital.
- Leverage up to 1:3000: Maximizing potential profits with one of the highest leverage options available.
- ‘Best Customer Service Broker Asia’ Award: Recognized excellence in customer support and service.
- Seasonal Promotions: Enjoy a variety of exclusive bonuses and promotional offers all year round.

>> Sign Up for FBS Broker Account here <<
Click here below to download: