


The forex market is probably the biggest trading market. The forex market trades with an average volume of about $5.1 trillion per day. This sheer market size means that the market could push a forex pair in one direction quite strongly.
A senior trader who is more adept to trading stocks once warned me about the volatility of the forex market. He warned me of the kind of moves that the forex market could make which is far more volatile than that of the stock market. Another seasoned forex trader also told me that in his experience the forex market is probably 10 times more difficult than the stock market due to its volatility. While it is true that the forex market is volatile and as a result could be very difficult to master, it is also a source of endless opportunities. Traders make money out of volatility. Without it prices become stagnant and they end up paying commissions and overnight swap charges without making any money. Volatility causes prices to move and traders to earn and the forex market has a lot of it.
Hyper Trend Forex Trading Strategy is a strategy that capitalizes on such volatility. It is aimed at detecting strong trending market conditions at its onset to allow traders to capitalize on such trends. Traders could easily multiply their profits if used in the right market condition.
Volatility Hyper Trend
Volatility Hyper Trend is a custom indicator that helps traders identify trend direction and potential trend reversals based on strong reversal moves made by the market.
This indicator is based on the Average True Range (ATR). It identifies trend direction based on price moving in a certain direction. It also indicates a potential reversal whenever it detects that price has reversed against its current trend greater than a multiple of the ATR.
Volatility Hyper Trend also behaves much like the Relative Strength Index (RSI). It also follows and shadows the movements of price action quite reliably. The difference is that this indicator plots two lines that intersect in order to identify trend direction and trend reversals.
Volatility Hyper Trend is displayed as an oscillator with a separate window. It plots two lines that mimic the movement of price action. Its main line is green while its signal line changes color depending on the direction of the trend. If the green line is above the signal line, the signal line becomes red. This indicates a bullish trend bias. On the other hand, if the green line crosses below the signal line, the signal line changes to blue. This indicates a bearish trend bias. Crossovers between the two lines indicate a trend reversal. This indicator also conveniently plots arrows to indicate the direction of a trend reversal whenever it detects one.
Relative Strength Index
The Relative Strength Index (RSI) is a technical indicator that measures the magnitude of current price movements compared to historical prices. It helps traders identify the direction of a trend as well as the strength of a momentum.
It is an oscillator that displays a line that oscillates within the range of 0 to 100, with a midline at 50. If the RSI line is staying above 50, then the market is in a bullish trend bias. On the other hand, if the RSI line is staying below 50, then the market is in a bearish trend bias. Some traders add markers at 45 and 55 as an additional support or resistance. In their mind, the RSI line may temporarily cross 50, if these two levels hold, then the market still has not reversed.
The RSI also typically has markers at 30 and 70. These levels indicate overbought and oversold levels. If the RSI line is below 30, then the market is considered oversold. If the RSI line is above 70, then the market is considered overbought.
Inversely, momentum traders use this as a basis to identify momentum. In their minds, if the RSI line breaches above 70, then the market has a bullish momentum, and if the RSI line is below 30, then the market has a bearish momentum.
Trading Strategy
This trading strategy is a trend following strategy that trades on reversals based on confluences coming from the Volatility Hyper Trend indicator and the RSI.
The Volatility Hyper Trend signals are simply based on the crossing over of the green line and the signal line, which also causes the line to change color and plot an arrow on the price chart.
The RSI line simply confirms the trend direction based on the location of the RSI line in relation to the 50 marker.
If the two signals are in confluence, trade setups could be valid.
Indicators:
- Volatility Hyper Trend
- Relative Strength Index
Preferred Time Frames: 15-minute, 30-minute, 1-hour, 4-hour and daily charts
Currency Pairs: FX majors, minors and crosses
Trading Sessions: Tokyo, London and New York sessions
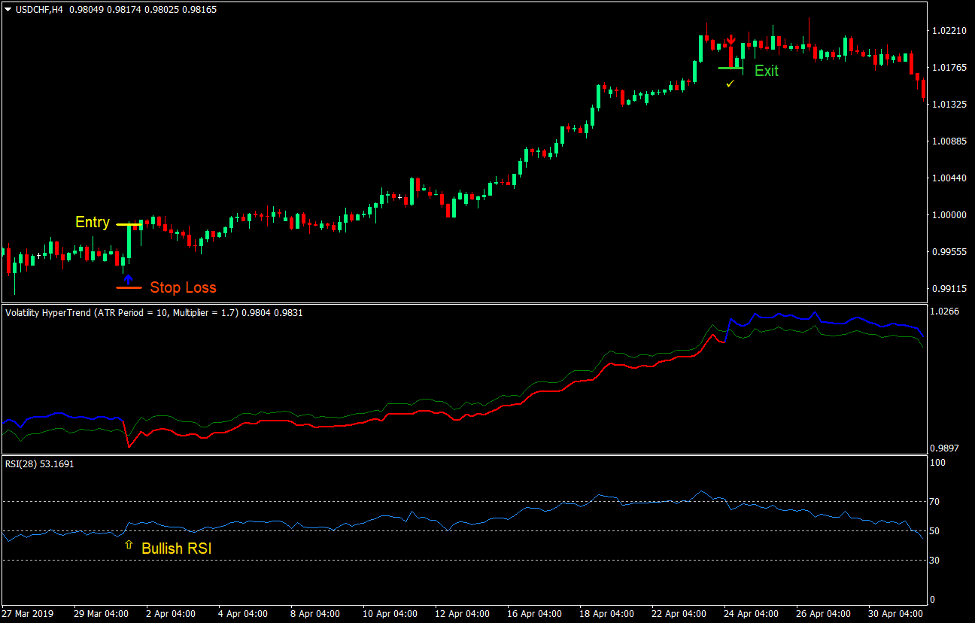
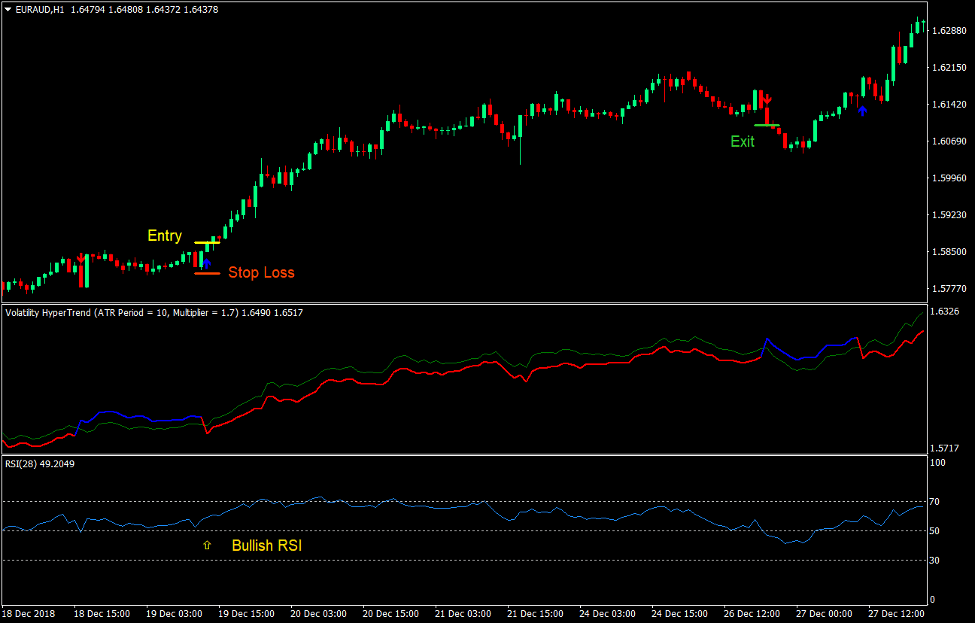
Buy Trade Setup
Entry
- The green line of the Volatility Hyper Trend indicator should cross above the signal line.
- The signal line should change to red.
- The RSI line should be above 50.
- Enter a buy order upon confirmation of the conditions above.
Stop Loss
- Set the stop loss on the support level below the entry candle.
Exit
- Close the trade as soon as the Volatility Hyper Trend indicator plots an arrow pointing down.
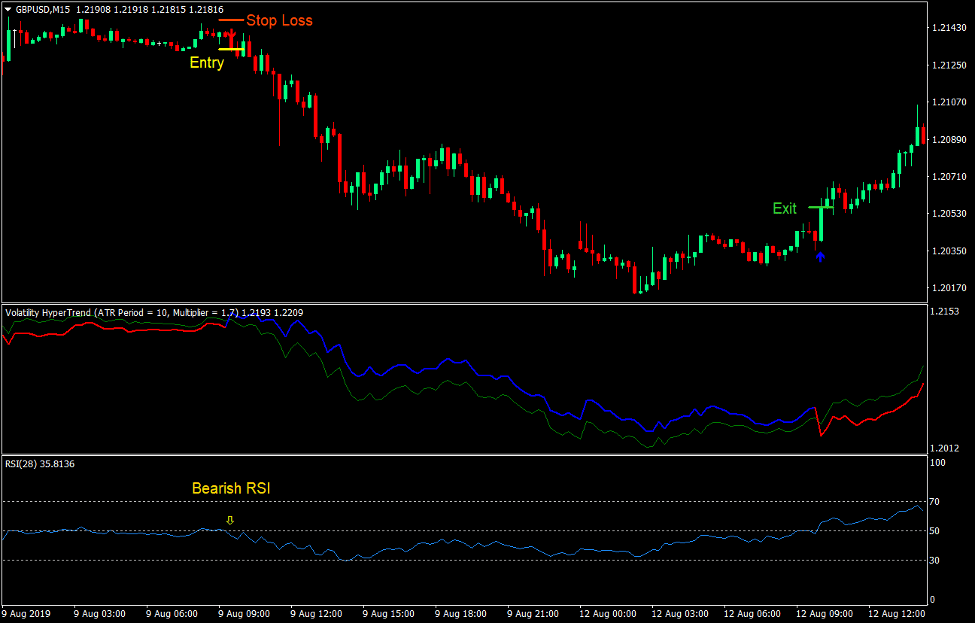
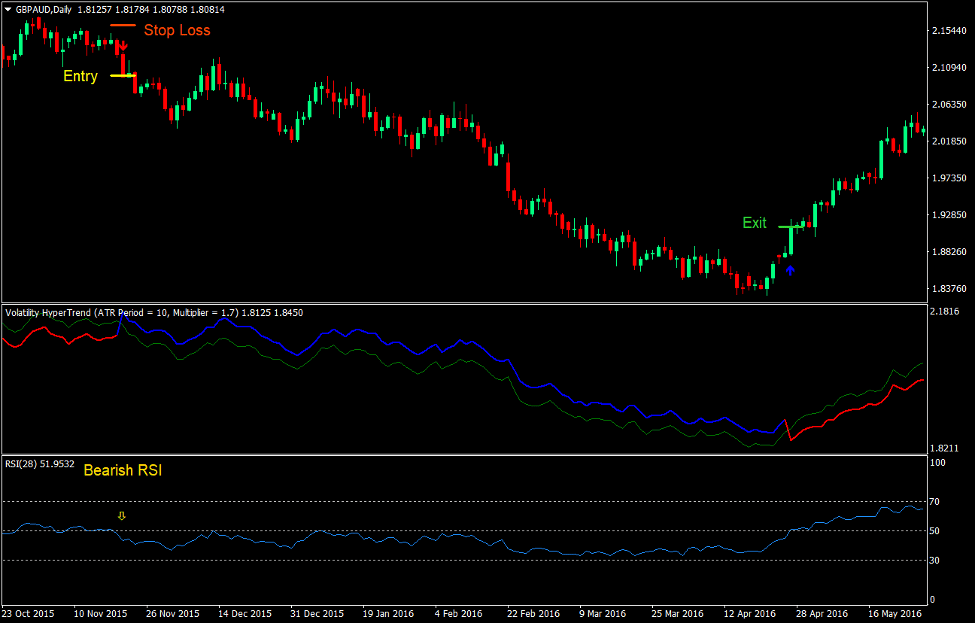
Sell Trade Setup
Entry
- The green line of the Volatility Hyper Trend indicator should cross below the signal line.
- The signal line should change to blue.
- The RSI line should be below 50.
- Enter a sell order upon confirmation of the conditions above.
Stop Loss
- Set the stop loss on the resistance level above the entry candle.
Exit
- Close the trade as soon as the Volatility Hyper Trend indicator plots an arrow pointing up.
Conclusion
This trading strategy is a high yield type of trading strategy. It allows traders to profit because of the trade setups that could result in high yields if the market momentum would result in a trend.
However, not all trade setups would be profitable. Traders would benefit much if they would consider support and resistance levels to anticipate reversals. Price action would also be a good supporting confirmation for this type of trading strategy.
Recommended MT4 Brokers
XM Broker
- Free $50 To Start Trading Instantly! (Withdraw-able Profit)
- Deposit Bonus up to $5,000
- Unlimited Loyalty Program
- Award Winning Forex Broker
- Additional Exclusive Bonuses Throughout The Year

>> Sign Up for XM Broker Account here <<
FBS Broker
- Trade 100 Bonus: Free $100 to kickstart your trading journey!
- 100% Deposit Bonus: Double your deposit up to $10,000 and trade with enhanced capital.
- Leverage up to 1:3000: Maximizing potential profits with one of the highest leverage options available.
- ‘Best Customer Service Broker Asia’ Award: Recognized excellence in customer support and service.
- Seasonal Promotions: Enjoy a variety of exclusive bonuses and promotional offers all year round.

>> Sign Up for FBS Broker Account here <<
Click here below to download: