


Trend reversal entry strategies can be excellent tools that may help traders open trades more precisely on the lower timeframes. In fact, most multi timeframe traders use trend reversal strategies on a drilled down timeframe in order to find their optimal trade entries.
The strategy discussed below is a trend reversal strategy that uses the Higher Highs and Lower Lows Stochastic Indicator and moving average crossovers, which can be used as a trade entry setup.
Higher Highs and Lower Lows Stochastic Indicator
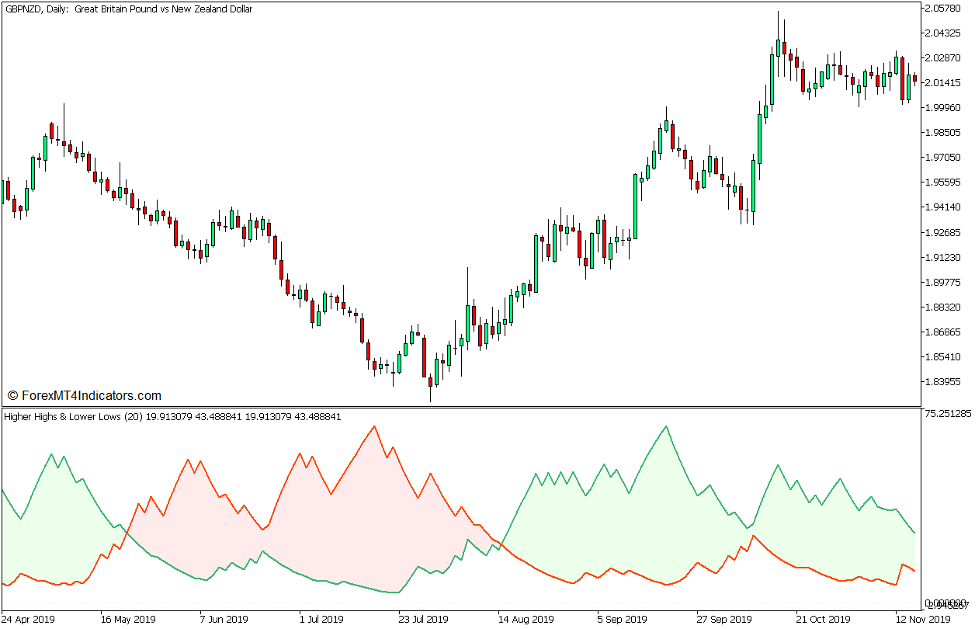
The Higher Highs and Lower Lows Stochastic (HHLLS) Indicator is a trend following technical indicator which is based on Vitali Apirine’s theory in his article “Higher Highs & Lower Lows”. The HHLLS indicator was developed to help traders identify potential emerging trends, observe market correction periods, and anticipate potential market reversals.
The HHLLS Indicator uses an algorithm that calculates for the Higher High Values and Lower Low Values derived from the recent historical data of the highs and lows of price from each candle. It then plots the Higher High Values and the Lower Low Values as lines which oscillate within a range that is normalized within 100. These lines are the Higher High and Lower Low lines. The Higher High line is plotted as a green line, while the Lower Low line is plotted as an orange red line. The indicator also shades the area between the two lines based on which of the two lines is on top.
The HHLLS Indicator can be used to identify trend direction based on the relationship of the Higher High and Lower Low lines. The trend bias or momentum is bullish whenever the Higher High line is above the Lower Low line. Inversely, the trend bias or momentum is bearish if the Lower Low line is above the Higher High line. These crossovers would also prompt the color change of the shade between the two lines. Such crossovers may be used as a trend or momentum reversal signal.
As an oscillator, the HHLLS Indicator can also be used to identify oversold and overbought markets. Traders can observe if the Higher High or Lower Low line is nearing the top end of the oscillator range and judge whether the market is overbought or oversold based on this.
10 EMA and 20 EMA Crossover
Moving average lines can be useful indicators for identifying trend directions and potential trend reversals. It is not a perfect tool, but it can be helpful for traders who are not yet confident in spotting trends using price action alone.
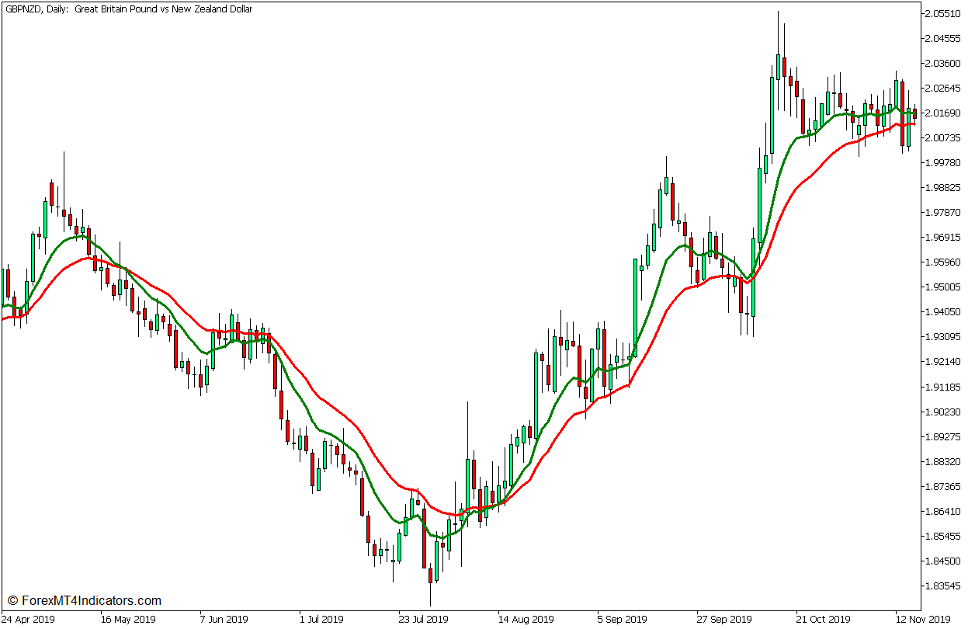
One of the ways traders identify trend direction using moving average lines is by pairing two moving average lines wherein one is noticeably more responsive to price movements compared to its pair. Traders may identify a bullish trend whenever the faster moving average line is above the slower moving average line. On the other hand, the trend would be bearish if the faster moving average line is below the slower moving average line. Given this premise, it also follows that crossovers between the faster and slower moving average lines may also be used as a potential trend reversal signal.
In this strategy, we will be using the 10-bar Exponential Moving Average (EMA) and the 20-bar EMA lines to decipher trend direction and potential trend reversals. The Exponential Moving Average method plots a more responsive moving average line, which significantly decreases lag, while at the same time retain the smoothness of its oscillations, lessening its susceptibility to price spikes. The 10-bar and 20-bar period also provides signals which are more attuned to the short-term trend direction. This allows traders to respond quicker to trend changes.
Trading Strategy Concept
Higher Highs and Lower Lows Stochastic Reversal Forex Trading Strategy for MT5 is a trend reversal trading strategy which uses the confluence between a moving average crossover and the Higher Highs and Lower Lows Stochastic indicator as a basis for identifying and confirming potential trend reversals.
Potential trend reversals may be observed on the HHLLS indicator based on the crossing over of the Higher Highs line and the Lower Lows line. The direction of the trend reversal would be based on whether the Higher Highs line is crossing above the Lower Lows line or vice versa.
Such reversal signal should not be a standalone signal. It should also be confirmed based on price action breaking either a swing high or a swing low depending on the direction of the trend. This would indicate that a potential trend reversal is possible.
The potential trend reversal is then confirmed only when the above indications is in confluence with the crossing over of the 10 EMA and 20 EMA lines in agreement with the direction of the signals indicated above.
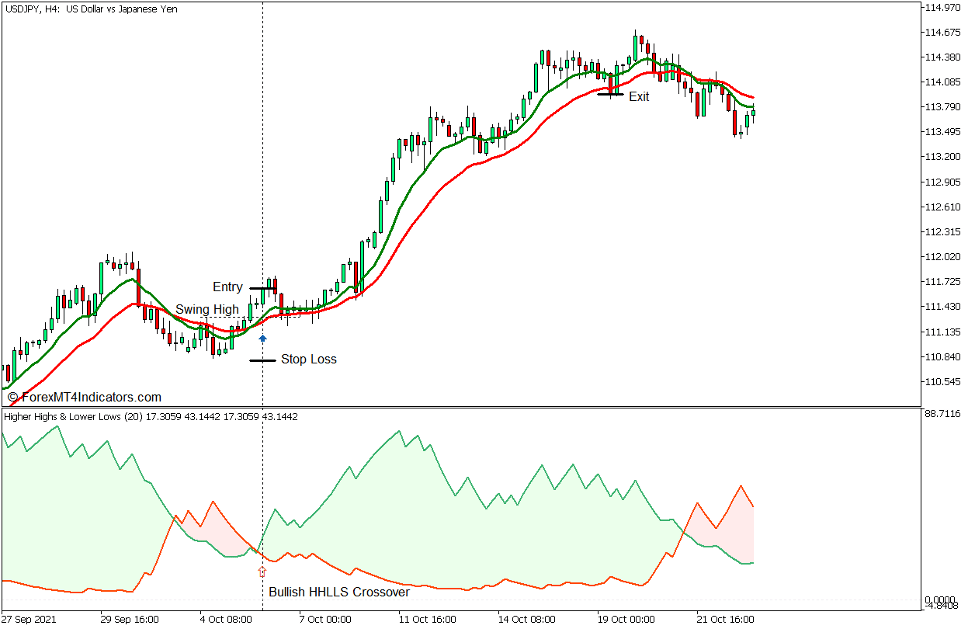
Buy Trade Setup
Entry
- The Higher Highs line should cross above the Lower Lows line.
- Price action should break and close above the most recent swing high.
- The 10 EMA line (green) should cross above the 20 EMA line (red).
- Open a buy order on the confluence of these indications.
Stop Loss
- Set the stop loss below the most recent swing low.
Exit
- Close the trade only when price would close below the 20 EMA line.
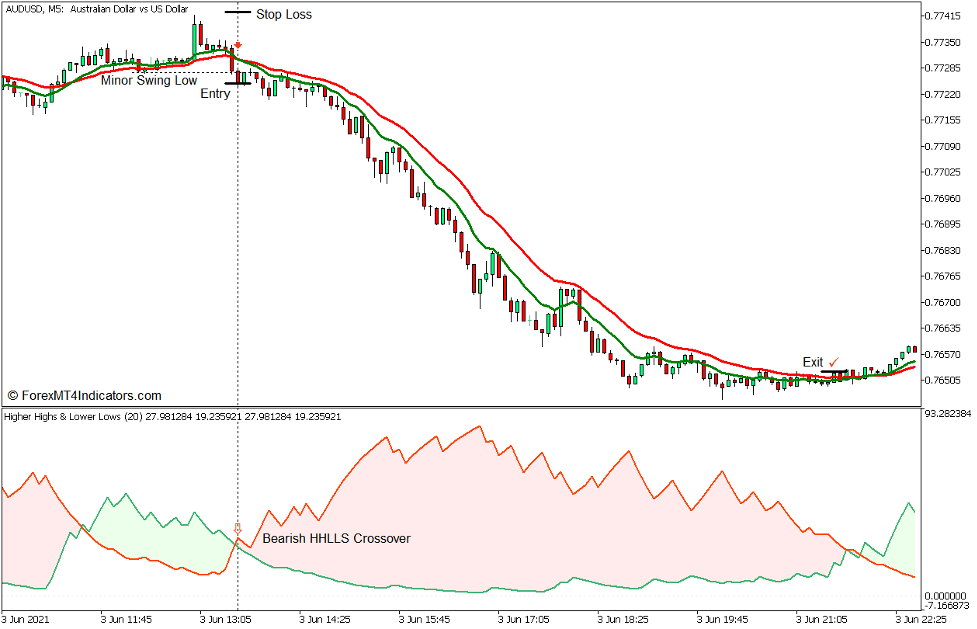
Sell Trade Setup
Entry
- The Lower Lows line should cross above the Higher Highs line.
- Price action should drop and close below the most recent swing low.
- The 10 EMA line (green) should cross below the 20 EMA line (red).
- Open a sell order on the confluence of these indications.
Stop Loss
- Set the stop loss above the most recent swing high.
Exit
- Close the trade only when price would close above the 20 EMA line.
Conclusion
Identifying potential trend reversals based on the reversals of price action, which is indicated by a break of a swing high or swing low is already an effective reversal signal. However, this technique may be daunting to new traders who are not yet used to the subjectivity of identifying reversals based on price action. Adding the confluence of the two indicator-based reversal signals add an element of objectivity in the trade signal, allowing traders to enter trades in a systematic manner.
The trading strategy discussed above can be a very effective trade entry strategy. However, it is best used in confluence with other trade setups based on a higher timeframe trading strategy.
Recommended MT5 Brokers
XM Broker
- Free $50 To Start Trading Instantly! (Withdraw-able Profit)
- Deposit Bonus up to $5,000
- Unlimited Loyalty Program
- Award Winning Forex Broker
- Additional Exclusive Bonuses Throughout The Year

>> Sign Up for XM Broker Account here <<
FBS Broker
- Trade 100 Bonus: Free $100 to kickstart your trading journey!
- 100% Deposit Bonus: Double your deposit up to $10,000 and trade with enhanced capital.
- Leverage up to 1:3000: Maximizing potential profits with one of the highest leverage options available.
- ‘Best Customer Service Broker Asia’ Award: Recognized excellence in customer support and service.
- Seasonal Promotions: Enjoy a variety of exclusive bonuses and promotional offers all year round.

>> Sign Up for FBS Broker Account here <<
Click here below to download: