


Trend reversals are some of the most profitable trading scenarios that traders could profit from. Markets that are trending tend to continue in one direction for quite a long time. This allows traders who were able to anticipate the trend reversal near the beginning of the trend to profit greatly from such a trade. Profits can run high as pips move in the direction of the trade made by the trend reversal trader.
Although trading trend reversals seem to be a very good idea, it is often easier said than done. This is because trend reversals are very difficult to anticipate. Often, traders mistakenly take deep retracements as a trend reversal signal, causing them to trade against the direction of a strong prevailing trend.
What traders need in order to profit greatly from trend reversals is to have a logical and systematic method to anticipate trend reversals.
One of the best ways to anticipate a trend reversal is by using crossovers of moving averages. With the right parameters and trade setups, moving average crossovers can systematically pinpoint potential trend reversals based on the crossing over of a moving average line over a slowing moving average line. However, not all moving average crossovers would work. Some setups are better than others. There are also instances when modified moving averages and custom technical indicators are used.
Donchian Channels
The Donchian Channels is a band-based trend-following technical indicator developed by Richard Donchian.
It is formed by taking the highest high and lowest low of price action within a specified period or number of candles. The midline of the Donchian Channel is plotted based on the median of the specified range. The highest high and lowest low of the same price range is also marked by the upper and lower bands of the Donchian Channel.
The Donchian Channel can be used much like the other band or channel based technical indicators. Price breaching above or dropping below the upper and lower bands could indicate a possible momentum breakout. Price action showing signs of rejection on the said area could also indicate a possible mean reversal.
The midline of the Donchian Channel can also be used just like other moving average lines. It can be used to identify the direction of the trend based on the general location of price action in relation to it.
Triangular Moving Average
The Triangular Moving Average (TMA) is a modified version of the basic moving average line.
Moving averages are one of the most widely used trend following technical indicators. Its simplicity and effectivity allow traders to easily decipher the direction of a trend. Traders can identify trend direction based on the general location of price action in relation to a moving average line, as well as the direction of the slope of the line.
Despite its simplicity and effectivity, moving averages tend to be susceptible to false signals which commonly occurs during range bound markets.
Triangular Moving Average attempts to address this by smoothening the moving average line based on a modified calculation. In fact, the TMA double smooths the moving average line. This creates a line that tends to be more stable, making it less susceptible to false signals.
Relative Strength Index
The Relative Strength Index (RSI) is a classic momentum technical indicator which is plotted as an oscillator.
The RSI plots a line that oscillate within the range of 0 to 100 with a midpoint at 50. An RSI line staying above 50 indicates a bullish trend bias, while an RSI line staying below 50 indicates a bearish trend bias.
It also typically has markers at level 30 and 70. An RSI line above 70 while price action is showing signs of a bearish reversal could indicate that price is overbought and is due for a mean reversal. On the other hand, an RSI line below 30 while price action is indicating a bullish reversal could mean that price is oversold and is due for a bullish mean reversal.
Momentum traders on the other hand view breaches above 70 and drops below 30 as an indication of a strong momentum. All it boils down to is the characteristics of price action during these conditions, whether price action is showing signs of reversal or a strong momentum breakout.
Some traders add level 45 and 55 on the price chart to confirm trending markets. Level 45 acts as a support level during a bullish trend. Level 55 acts a resistance level during a bearish trend.
Trading Strategy
Donchian MA Crossover Forex Trading Strategy is a simple trend reversal strategy which is based on the cross over of two trend following technical indicators.
Trend reversal setups are identified based on the crossing over of the midline of the Donchian Channel and the TMA line.
The trend reversal should then be confirmed by the RSI line crossing above 55 in a bullish trend or dropping below 45 in a bearish trend. The line would then respect level 45 as a support in a bullish trend or 55 as a resistance in a bearish trend if the trade setup does develop into a trend.
Momentum is also confirmed based on price closing outside of the Donchian Channel.
Indicators:
- Donchian Bands
- TMA
- Periods: 36
- Relative Strength Index
- Period: 19
Preferred Time Frames: 30-minute, 1-hour, 4-hour and daily charts
Currency Pairs: FX majors, minors and crosses
Trading Sessions: Tokyo, London and New York sessions
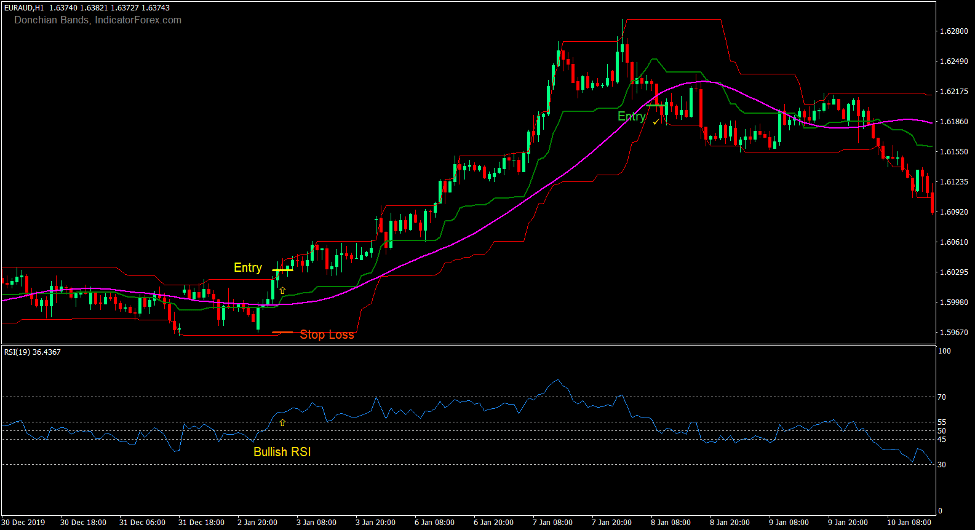
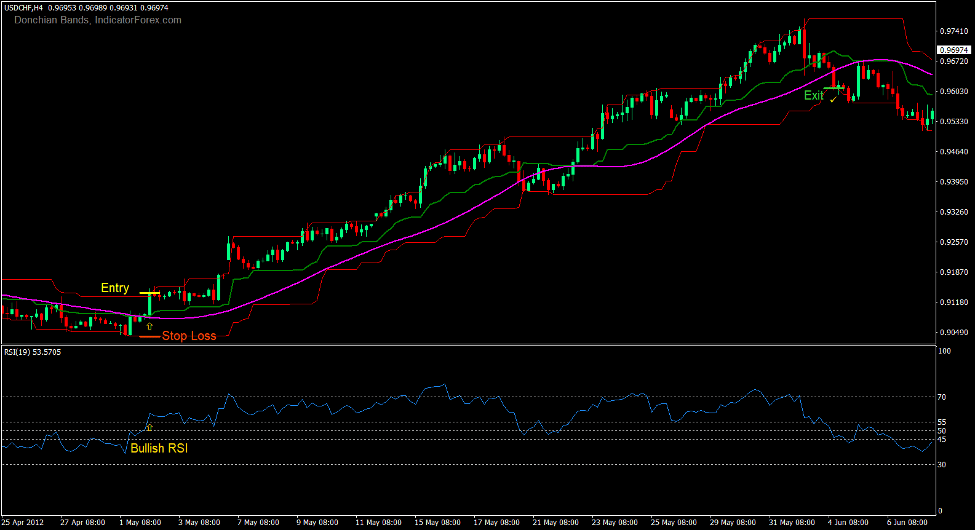
Buy Trade Setup
Entry
- The midline of the Donchian Channels should cross above the TMA line.
- The RSI line should cross above 55.
- A bullish candle should close above the upper line of the Donchian Channel.
- Enter a buy order on the confirmation of these conditions.
Stop Loss
- Set the stop loss on a support below the entry candle.
Exit
- Close the trade as soon as price closes below the lower line of the Donchian Channel.
- Close the trade as soon as the midline of the Donchian Channel crosses below the TMA line.
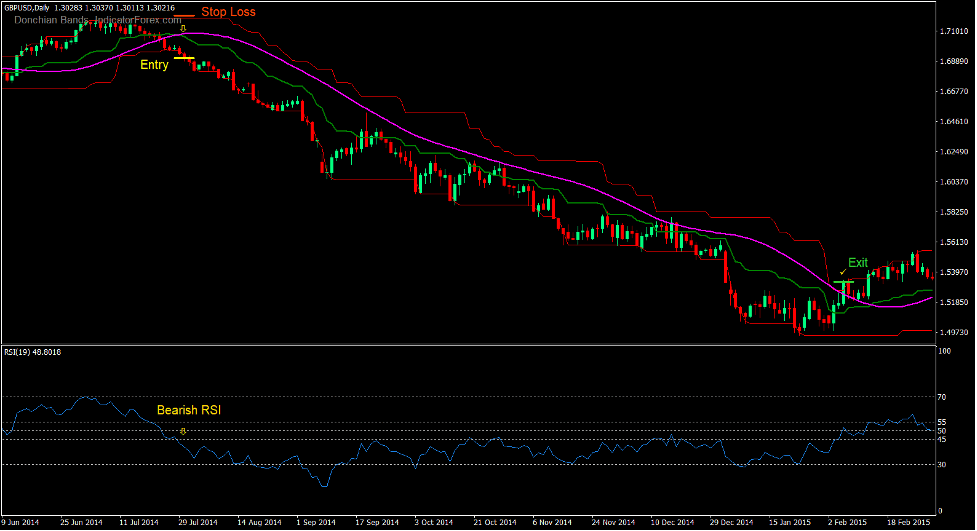
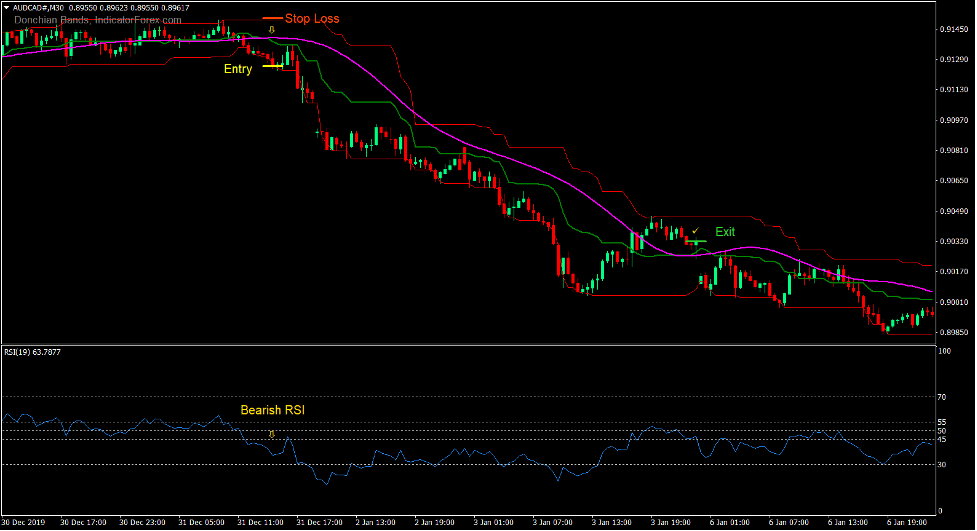
Sell Trade Setup
Entry
- The midline of the Donchian Channels should cross below the TMA line.
- The RSI line should cross below 45.
- A bearish candle should close below the lower line of the Donchian Channel.
- Enter a sell order on the confirmation of these conditions.
Stop Loss
- Set the stop loss on a resistance above the entry candle.
Exit
- Close the trade as soon as price closes above the upper line of the Donchian Channel.
- Close the trade as soon as the midline of the Donchian Channel crosses above the TMA line.
Conclusion
This trading strategy is a simple trend reversal strategy which could work very well in the right market condition. It is very effective in markets that has a strong tendency to reverse strongly and has deep price swings.
It is also best to trade this strategy in conjunction with momentum breakout price action scenarios.
Recommended MT4 Brokers
XM Broker
- Free $50 To Start Trading Instantly! (Withdraw-able Profit)
- Deposit Bonus up to $5,000
- Unlimited Loyalty Program
- Award Winning Forex Broker
- Additional Exclusive Bonuses Throughout The Year

>> Sign Up for XM Broker Account here <<
FBS Broker
- Trade 100 Bonus: Free $100 to kickstart your trading journey!
- 100% Deposit Bonus: Double your deposit up to $10,000 and trade with enhanced capital.
- Leverage up to 1:3000: Maximizing potential profits with one of the highest leverage options available.
- ‘Best Customer Service Broker Asia’ Award: Recognized excellence in customer support and service.
- Seasonal Promotions: Enjoy a variety of exclusive bonuses and promotional offers all year round.

>> Sign Up for FBS Broker Account here <<
Click here below to download: