


Crossover strategies are one of the most basic trading strategies available to traders. Often, new traders would come across a crossover strategy during the initial phases of their trading careers. Many would try it, experiences some wins and some losses. The problem is that often, new traders would experience the inevitable drawdown, which crossover strategies also have. The thing is, crossover strategies are not high probability trading strategies. However, crossover strategies excel in squeezing out pips on a strong trend from start to finish. This allows for a high reward-risk strategy.
The Technical Cross Forex Trading Strategy employs a crossover strategy with the capacity to catch high reward-risk trade setups and ride the trend from start to finish. This is done using a couple of technical indicators which could be used as a basis for crossovers.
100 Pips Momentum BO
The 100 Pips Momentum BO custom indicator is an indicator based on a modified moving average. It is composed of two moving averages, one fast and one slow. These two modified moving averages on their own could be used as entry signals of a crossover strategy. This indicator works particularly well in determining short-term trends. However, given the short-term nature of this indicator, it is quite susceptible to losses during choppy markets and short retracements which go against a bigger picture trend.
Execute Line
The Execute Line is a custom indicator which also based on a modified moving average. It is composed of a single modified moving average line which changes color depending on the slope of the moving average. This indicator, although with only one moving average, could also be a standalone trend reversal entry signal. This is because one way of determining the direction of the trend is through the slope of a moving average. If the direction of the slope changes, it could be argued that the trend has changed direction.
Moving Average Convergence and Divergence
The Moving Average Convergence and Divergence (MACD) is a widely used technical indicator. It is a trend-following momentum indicator based on a set of exponential moving averages, plotted as an oscillating indicator. The MACD line is based on the difference between a fast moving average and a slower moving average. The MACD line is then paired with a signal line, which is still an exponential moving average but is usually faster than the two lines. The difference between the MACD line and the signal line could also be plotted as histograms. Whenever the MACD line and the signal line crosses over, the histogram representing the difference between the two would also cross over the midline. These crossovers are typically considered as entry signals.
Although crossovers based on the MACD is typically considered an entry signal, some crossovers have a higher probability of success than others. This is because the MACD line and the signal line would usually return to the mean, which is the midline. Bullish crossovers that occur below the midline usually has a higher success rate than bullish crossovers occurring above the midline. In the same manner, bearish crossovers occurring above the midline would have a better chance of success than a bearish crossover occurring below the midline.
Trading Strategy Concept
Given the concept behind the MACD, we could say that entry strategies based on the MACD could also be considered a moving average crossover strategy since its lines are derived from moving averages. These entry signals from the MACD would be one of our confirmation and filters.
The second confirmation would be the crossing over of the 100 Pips Momentum BO lines and the Execute Line. Bullish setups should be preceded by the 100 Pips Momentum BO lines crossing above the Execute Line. Bearish setups would be preceded by the 100 Pips Momentum BO lines crossing below the Execute Line.
The final entry signal would be the changing of the Execute Line’s color. This represents the changing of the slope of the mid-term moving average, which also confirms the changing of the trend.
Indicators:
- 100pips Momentum_BO
- (T_S_R)-Execute Line
- Period: 90
- Method: 3
- 2line_MACD
- Fast MA Period: 20
- Slow MA Period: 36
- Signal MA Period: 27
Timeframe: 15-min, 30-min, 1-hour, 4-hour and daily charts
Currency Pair: any major and minor pair plus some crosses
Trading Session: any
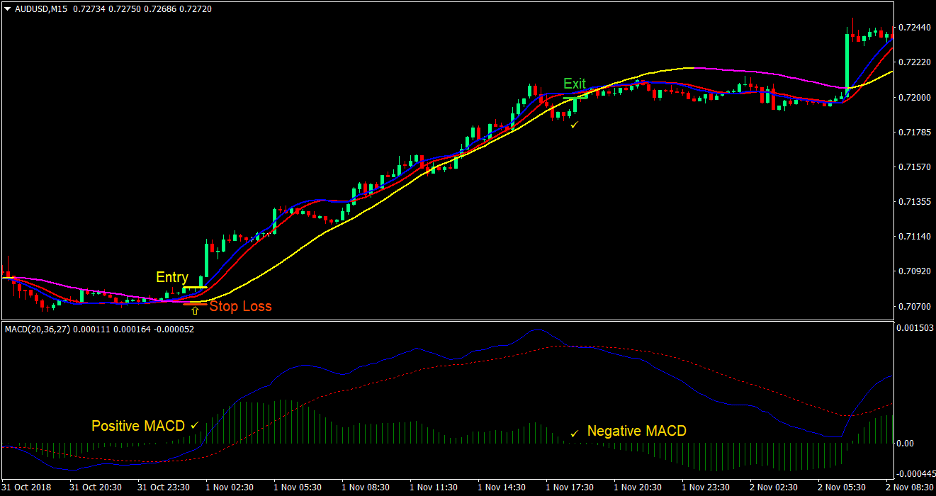
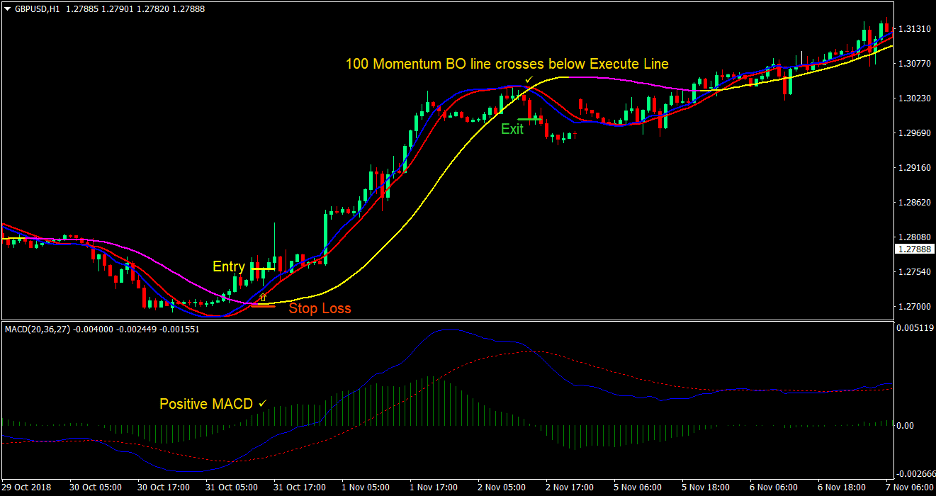
Buy (Long) Trade Setup
Entry
- The MACD’s solid blue line should cross above the broken red line below the midline
- The MACD should print positive histogram bars
- The 100 Pips Momentum BO indicator’s lines should cross above the Execute Line
- The Execute Line should turn to color yellow
- Enter a buy order at the confluence of these conditions
Stop Loss
- Set the stop loss below the Execute Line
Exit
- Close the trade if the MACD starts printing negative histogram bars
- Close the trade if the 100 Pips Momentum BO lines cross below the Execute line
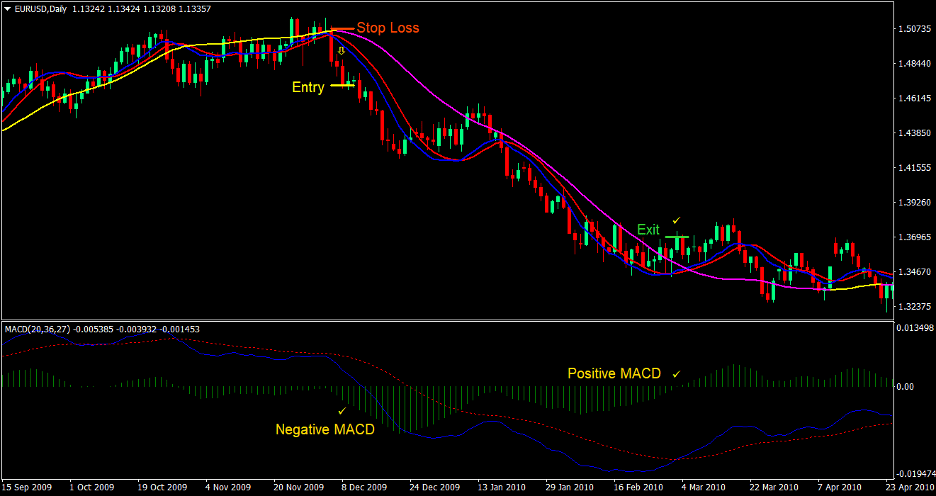
Sell (Short) Trade Setup
Entry
- The MACD’s solid blue line should cross below the broken red line above the midline
- The MACD should print negative histogram bars
- The 100 Pips Momentum BO indicator’s lines should cross below the Execute Line
- The Execute Line should turn to color magenta
- Enter a sell order at the confluence of these conditions
Stop Loss
- Set the stop loss above the Execute Line
Exit
- Close the trade if the MACD starts printing positive histogram bars
- Close the trade if the 100 Pips Momentum BO lines cross above the Execute line
Conclusion
This strategy is a strategy that uses custom indicators based on moving averages as elements for a crossover strategy. These custom indicators are an entry signal on their own right which could be used as a focal point of a strategy. By using these indicators and setting them up to become complimentary indicators, we get to have a crossover strategy that has an improved win rate.
Although this crossover strategy has an improved win rate as compared to other standard crossover strategies. It is still susceptible to the inevitable drawdown periods common to crossover strategies. Still, it allows traders to be profitable due to the possibility of high reward-risk ratio trades since traders could ride a trend from start to finish using this strategy.
Recommended MT4 Brokers
XM Broker
- Free $50 To Start Trading Instantly! (Withdraw-able Profit)
- Deposit Bonus up to $5,000
- Unlimited Loyalty Program
- Award Winning Forex Broker
- Additional Exclusive Bonuses Throughout The Year

>> Sign Up for XM Broker Account here <<
FBS Broker
- Trade 100 Bonus: Free $100 to kickstart your trading journey!
- 100% Deposit Bonus: Double your deposit up to $10,000 and trade with enhanced capital.
- Leverage up to 1:3000: Maximizing potential profits with one of the highest leverage options available.
- ‘Best Customer Service Broker Asia’ Award: Recognized excellence in customer support and service.
- Seasonal Promotions: Enjoy a variety of exclusive bonuses and promotional offers all year round.

>> Sign Up for FBS Broker Account here <<
Click here below to download: