


One of the most basic skill when trading the forex markets should be learning how to read markets. By this I mean traders should learn how to assess whether a market is either trending, ranging or reversing. Traders who could correctly assess the market condition would have a better chance at making the right trade. However, this is just half the battle. Knowing what type of market means that you have an idea where the market might be moving to next. The market could still do the opposite move despite you reading the market right. If a trader does read the market condition right, timing the market would be another hurdle to tackle.
Timing trend reversals and bounces off a support or resistance on a ranging market might not be that easy for new traders. This is because reversals do have an element of going against the trend and timing when it will reverse. It is much like catching a falling knife. Catch the handle and you would be good. Catch the blade and you would bleed.
RSI Crossover Signal Forex Trading Strategy trades on trending markets as this is easier to decipher. Traders could visually identify if the market is trending using a couple of indicators. Then, using another short-term momentum indicator, traders could enter the market in the direction of the trend.
RSI Filter
The RSI Filter is a momentum indicator based on the Relative Strength Index (RSI).
The RSI indicator is an indicator with lots of uses. It helps traders identify trend direction, potential mean reversals coming from overbought or oversold prices, or momentum.
Identifying trend based on the RSI is straight forward. If the RSI line stays above 50 while respecting support at 45, then the market is in an uptrend. If the RSI line stays below 50 and respects resistance at 55, then the market is in a downtrend.
As an overbought and oversold indicator, the RSI has markers at 30 and 70. If price falls below 30, then the market could be oversold, while if price breaches 70, then the market could be overbought.
Inversely, momentum traders identify breaches beyond this line as a momentum signal. A breach above 70 indicates bullish momentum, while a drop below 30 indicates bearish momentum.
The RSI Filter is based on the momentum and trend concept of the standard RSI. It plots orange bars whenever it detects a bullish momentum and sky-blue bars when it detects a bearish momentum. It also stops plotting bars whenever the RSI line crosses over 50 indicating a probable momentum reversal.
MA in Color
The MA in Color indicator is a custom moving average indicator. It is a simple indicator based on the Exponential Moving Average (EMA).
It basically is an EMA line that detects trends based on the slope of the EMA line. It plots a green line whenever the EMA line sloping up indicating an uptrend. It plots a red line whenever it detects that the EMA line is sloping down indicating a downtrend. However, if the line is flattening out, the line becomes yellow indicating a non-trending market condition.
TSR Signal Line
The TSR Signal Line is also a custom moving average indicator which detects trend direction based on the slope of a moving average line.
Like the MA in Color indicator, it also changes color whenever the slope of the TSR Signal Line changes. A lime line indicates a bullish trend, while a red line indicates a bearish trend.
The difference between the TSR Signal Line and the MA in Color line is that the TSR Signal Line is based on a modified moving average. The line tends to move a bit more responsively making it great for short-term trends and momentum signals.
Trading Strategy
This trading strategy trades on trending market conditions wherein the momentum signal from the RSI filter, the mid-term trend from the MA in Color indicator, and the short-term momentum from the TSR Signal Line indicator are in confluence.
The RSI Filter is used primarily to confirm momentum direction. This will simply be based on the color of the bars it is plotting.
The MA in Color indicator will be used to identify the mid-term trend direction. This is based on the color of the MA in Color line, the general location of price action in relation to the line and the slope of the line. On top of this, traders should also confirm trend direction based on the swing points of price action.
Finally, the TSR Signal Line will be used as a short-term momentum entry signal. The color of the line would temporarily change during a retracement. Valid signals are generated whenever the color of the line shifts back to align with the direction of the mid-term trend.
Indicators:
- MA_in_Color
- MAPeriod: 36
- (T_S_R)-Signal Line
- Period: 20
- RSIFilter
Preferred Time Frames: 30-minute, 1-hour and 4-hour charts
Currency Pairs: FX majors, minors and crosses
Trading Sessions: Tokyo, London and New York sessions
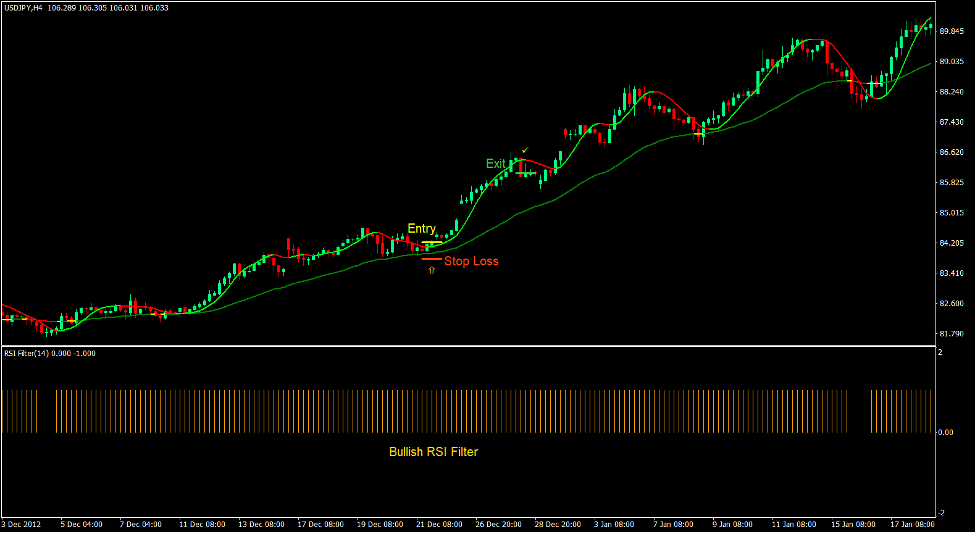
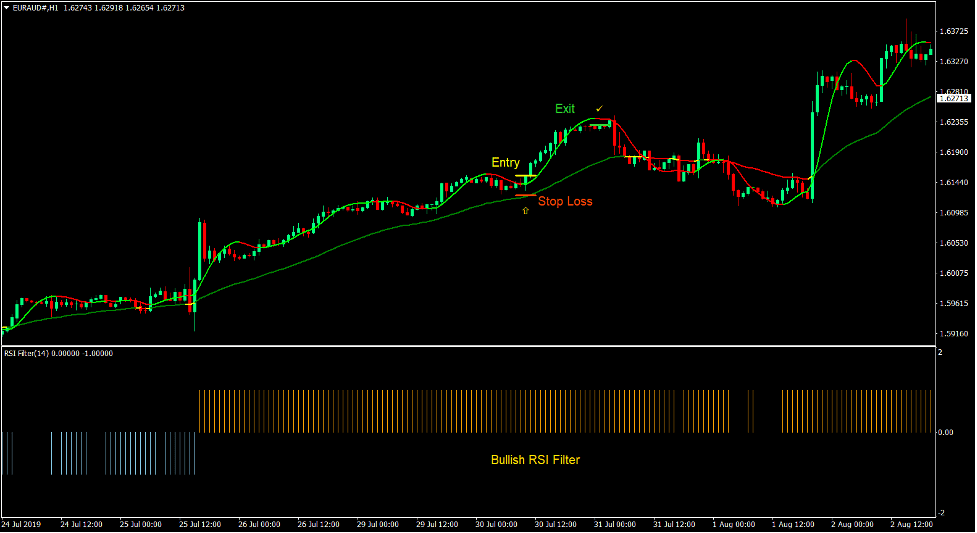
Buy Trade Setup
Entry
- The RSI Filter should be plotting orange bars.
- The MA in Color line should be green and should be sloping up.
- Price action should be above the MA in Color line and should be making higher swing highs and swing lows.
- The TSR Signal Line should change to lime.
- Enter a buy order upon confirmation of the conditions above.
Stop Loss
- Set the stop loss on the fractal below the entry candle.
Exit
- Close the trade as soon as the TSR Signal Line changes to red.
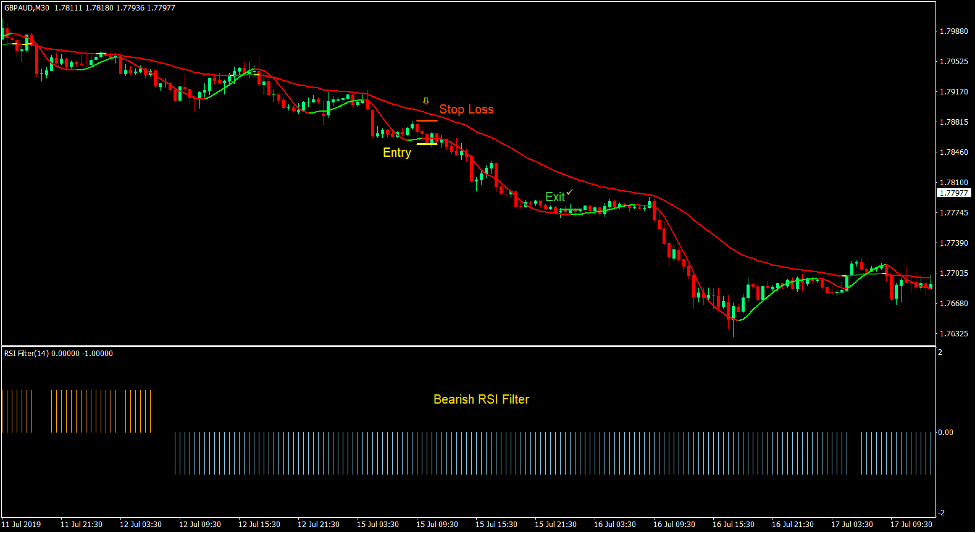
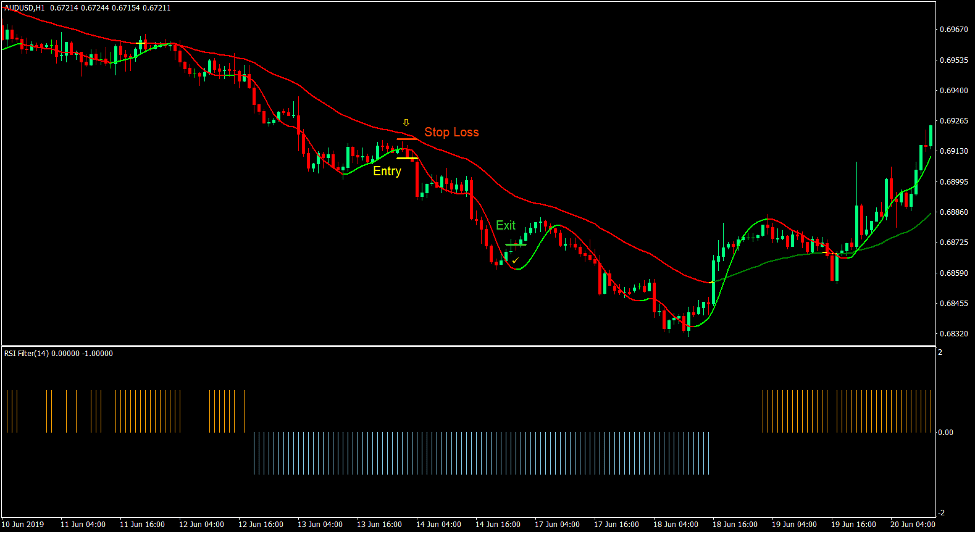
Sell Trade Setup
Entry
- The RSI Filter should be plotting sky-blue bars.
- The MA in Color line should be red and should be sloping down.
- Price action should be below the MA in Color line and should be making lower swing highs and swing lows.
- The TSR Signal Line should change to red.
- Enter a sell order upon confirmation of the conditions above.
Stop Loss
- Set the stop loss on the fractal above the entry candle.
Exit
- Close the trade as soon as the TSR Signal Line changes to lime.
Conclusion
This trading strategy is a great trend following strategy with a decent win rate and a positive reward-risk ratio. If traded in the right market condition, this strategy could do wonders.
The key to trading this strategy successfully is in identifying trending market conditions. Not all trades would be profitable even if traded in a trending market. However, it should produce more wins than losses and should have an average profit which is higher than the average loss in pips. Combining these two factors should allow traders to have a positive expectancy in the long-run.
Recommended MT4 Brokers
XM Broker
- Free $50 To Start Trading Instantly! (Withdraw-able Profit)
- Deposit Bonus up to $5,000
- Unlimited Loyalty Program
- Award Winning Forex Broker
- Additional Exclusive Bonuses Throughout The Year

>> Sign Up for XM Broker Account here <<
FBS Broker
- Trade 100 Bonus: Free $100 to kickstart your trading journey!
- 100% Deposit Bonus: Double your deposit up to $10,000 and trade with enhanced capital.
- Leverage up to 1:3000: Maximizing potential profits with one of the highest leverage options available.
- ‘Best Customer Service Broker Asia’ Award: Recognized excellence in customer support and service.
- Seasonal Promotions: Enjoy a variety of exclusive bonuses and promotional offers all year round.

>> Sign Up for FBS Broker Account here <<
Click here below to download: