


Mean reversal trading strategies are not as popular as other types of trading strategies. Most traders would often go for momentum trading strategies, breakout trading strategies, trend following strategies or trend reversal trading strategies.
However, in spite being not as popular as other types of strategies, mean reversal trading strategies are one of the more effective types of strategies. This is because mean reversal strategies work well in different types of trading conditions. It could be used in ranging markets and trending markets, granting that trades are taken in the direction of the trend.
Mean reversal strategies have some similarities with full blown trend reversal strategies. Both strategies aim to sell at peaks and buy at bottoms. The difference is in the type of trends that are expected to reverse. While trend reversal strategies are aimed at reversals from a longer-term trend, mean reversal strategies are geared towards shorter term reversals caused by the imbalance of overbought or oversold markets. These price extremes often cause price to reverse back to the mean causing a short-term reversal.
Pin Bar Correlation Reversal Forex Trading Strategy is a short-term mean reversal trading strategy. It identifies overbought and oversold conditions using a unique indicator. It also pinpoints probable reversal price points and the actual reversal signal, making trade execution much easier.
Spearman Correlation
Spearman’s rank correlation coefficient or Spearman’s rho, named after Charles Spearman, is a type of correlation used in statistics which is a nonparametric measure of rank correlation. This pertains to the statistical dependence between the rankings of two variables.
This method of statistical correlation is then applied to trading and developed as a technical indicator.
The Spearman Correlation indicator correlates the movement of price and a Simple Moving Average (SMA). Because the SMA is derived from price movements, it is natural that the two are directly correlated. However, the interesting part is that if the Spearman Correlation line is plotted on a window together with the SMA line, an effective oscillating indicator could be observed.
This oscillating indicator shares the same characteristics as the Stochastic Oscillator. It has two lines oscillating in a range between -1 and 1. The faster line is the Simple Moving Average, while the slower line is the Spearman Correlation line derived from the SMA.
Since the lines oscillate within a range, overbought and oversold conditions could easily be observed. In this setup, lines above 0.7 is considered overbought and lines below -0.7 is considered oversold. Mean reversal trade signals are generated whenever the lines crossover while overbought or oversold.
The indicator also identifies probable congestion price points whenever the two lines start to contract while overbought or oversold. This gives traders an early indication where price might reverse in the short-term.
Trading Strategy
This trading strategy provides trade signals based on the Spearman Correlation indicator.
To use this strategy, the lines on the Spearman Correlation indicator should indicate an overbought or oversold market condition. The indicator should also mark the area which price might reject.
Trade signals are considered valid whenever a pin bar price pattern occurs in confluence with an entry signal provided by the Spearman Correlation indicator.
Indicators:
- Correlation-mt4-indicator (default setting)
Preferred Time Frames: 15-minute, 30-minute, 1-hour and 4-hour charts
Currency Pairs: major and minor pairs
Trading Sessions: Tokyo, London and New York pairs
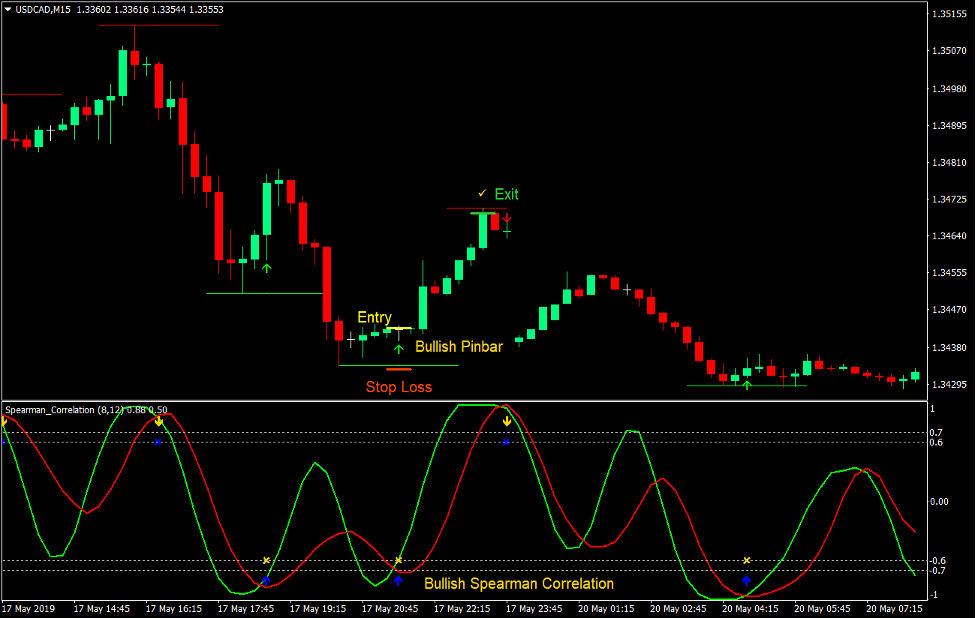
Buy Trade Setup
Entry
- The Spearman Correlation lines should both be below -0.7 indicating an oversold condition.
- The indicator should mark a lime line on the price chart indicating the area where price might reverse.
- Price should touch the lime line.
- The indicator should provide an entry signal indicated by an arrow pointing up.
- The candle corresponding the entry signal should be a bullish pin bar candle.
- Enter a buy order on the confirmation of these conditions.
Stop Loss
- Set the stop loss below the entry candle.
- Set the stop loss below the lime line.
Exit
- Close the trade as soon as a candle touches the red line marked by the indicator.
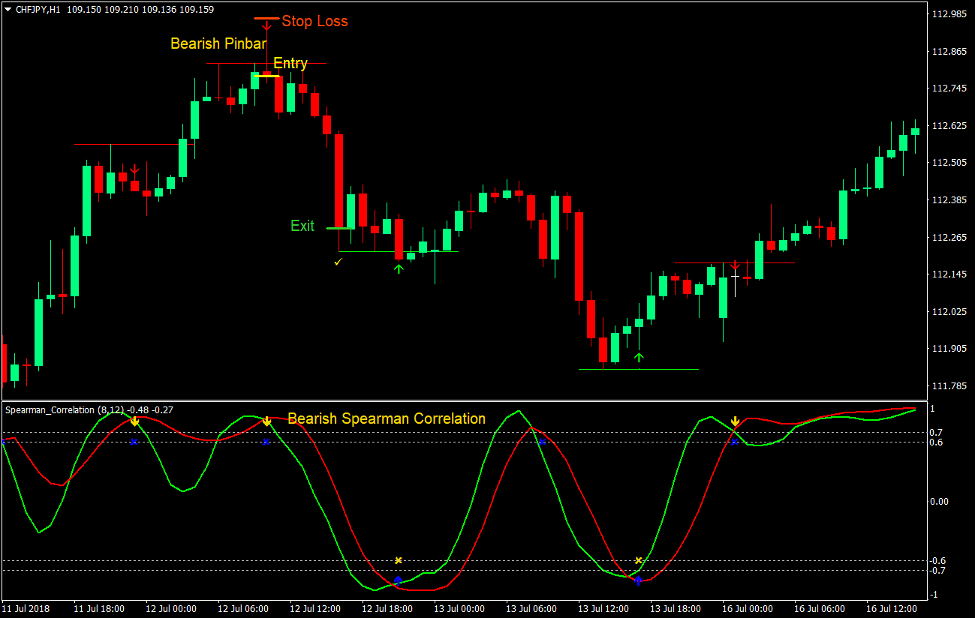
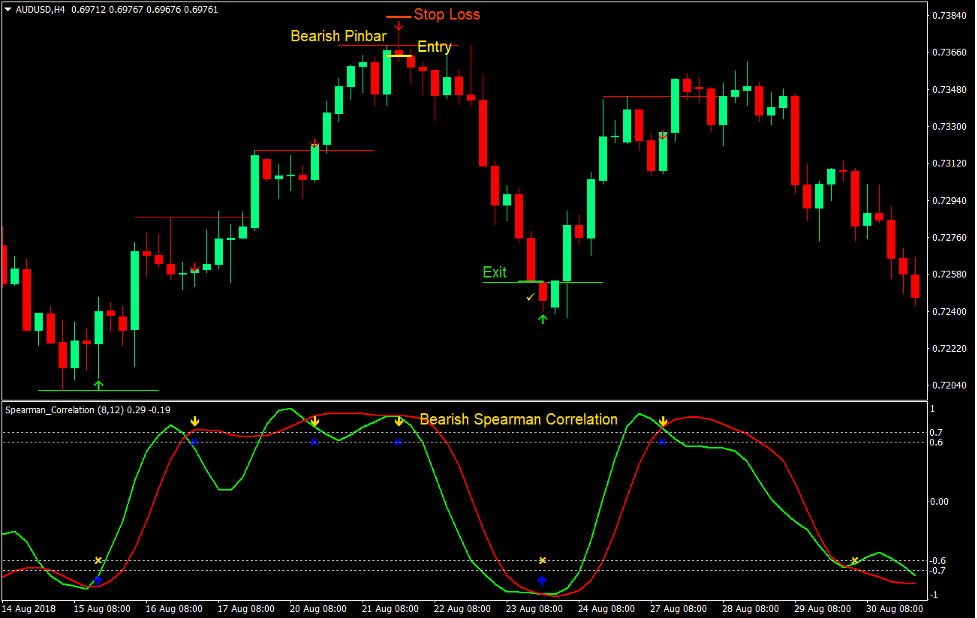
Sell Trade Setup
Entry
- The Spearman Correlation lines should both be above 0.7 indicating an overbought condition.
- The indicator should mark a red line on the price chart indicating the area where price might reverse.
- Price should touch the red line.
- The indicator should provide an entry signal indicated by an arrow pointing down.
- The candle corresponding the entry signal should be a bearish pin bar candle.
- Enter a sell order on the confirmation of these conditions.
Stop Loss
- Set the stop loss above the entry candle.
- Set the stop loss above the red line.
Exit
- Close the trade as soon as a candle touches the lime line marked by the indicator.
Correlation
Mean reversal strategies are one of the most effective types of trading strategies and this setup of a mean reversal signal is one of the most accurate signals.
If you would visually observe historical prices, you would notice how price would often follow the direction provided by the indicator based on the oscillation of the two lines. Price would typically reverse to the downside whenever a signal is generated while being overbought, and price would also reverse to the upside whenever a buy signal is generated while being oversold.
There cases however when signals are generated and price would provide some indications of a congestion which may lead to a short-term reversal, yet price would continue its initial trend direction. This is why it would still be smart to align trade setups with the longer-term trend.
Overall, this strategy is very effective and could provide consistent profits over the long-term. Master this and you could be on your way to consistent profits.
Recommended MT4 Brokers
XM Broker
- Free $50 To Start Trading Instantly! (Withdraw-able Profit)
- Deposit Bonus up to $5,000
- Unlimited Loyalty Program
- Award Winning Forex Broker
- Additional Exclusive Bonuses Throughout The Year

>> Sign Up for XM Broker Account here <<
FBS Broker
- Trade 100 Bonus: Free $100 to kickstart your trading journey!
- 100% Deposit Bonus: Double your deposit up to $10,000 and trade with enhanced capital.
- Leverage up to 1:3000: Maximizing potential profits with one of the highest leverage options available.
- ‘Best Customer Service Broker Asia’ Award: Recognized excellence in customer support and service.
- Seasonal Promotions: Enjoy a variety of exclusive bonuses and promotional offers all year round.

>> Sign Up for FBS Broker Account here <<
Click here below to download: