


There are many ways to trade a trend continuation strategy in a trending market condition. Trading on pullbacks using a Dynamic Area of Support or Resistance is probably one of the simplest ways traders may trade such type of trading strategy. The only element of the trade setup that a trader would need after determining the area where price would pull back towards is the trade entry.
The strategy below shows us how we can use the OsHMA Indicator as a trade entry signal when used in a trend continuation type of strategy.
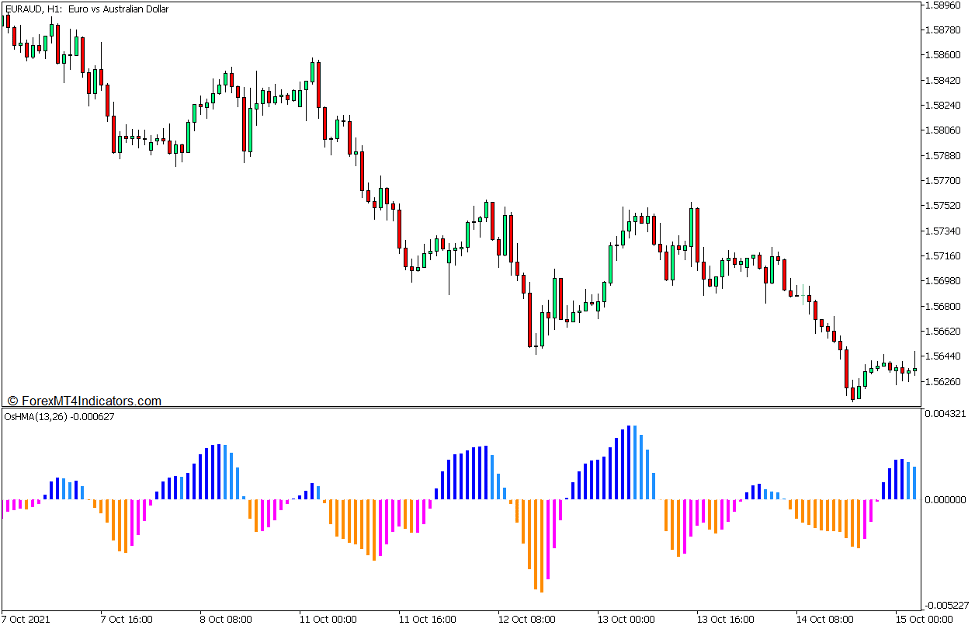
OsHMA Indicator
The OsHMA Indicator is a custom indicator which was developed to help traders identify momentum direction. It presents momentum direction as an oscillator type of technical indicator which plots histogram bars that oscillate around a midline which is zero.
This indicator is a modification of the Oscillator of Moving Averages Indicator or OsMA. The basic OsMA indicator is an oscillator which is derived from another oscillator, such as the Moving Average Convergence and Divergence (MACD) indicator. The OsMA indicator basically computes for a moving average of the underlying oscillator, then subtracts the value of the oscillator and its moving average.
The OsHMA Indicator on the other hand uses a modified moving average line to calculate for the average of its underlying oscillator, which is the Hull Moving Average (HMA). The Hull Moving Average was developed to produce a smoothened moving average line and at the same time plot a responsive moving average with less lag. Since the OsHMA Indicator uses the HMA as its method for calculating moving averages, the bar oscillations that the OsHMA Indicator plots has an excellent balance of having less lag but is also less susceptible to market noise.
The OsHMA Indicator plots histogram bars that oscillate around zero. The color of the bars that it plots also changes depending on whether the bars are positive or negative, and based on whether its value is higher or lower compared to its preceding bar. It plots blue bars for positive bars with rising values, and dodger blue bars for positive bars with dropping values. On the other hand, it also plots orange bars for negative bars with dropping values, and magenta bars for negative bars with rising values. This feature allows users to easily identify momentum direction as well as potential momentum reversals.
Dynamic Area of Support and Resistance
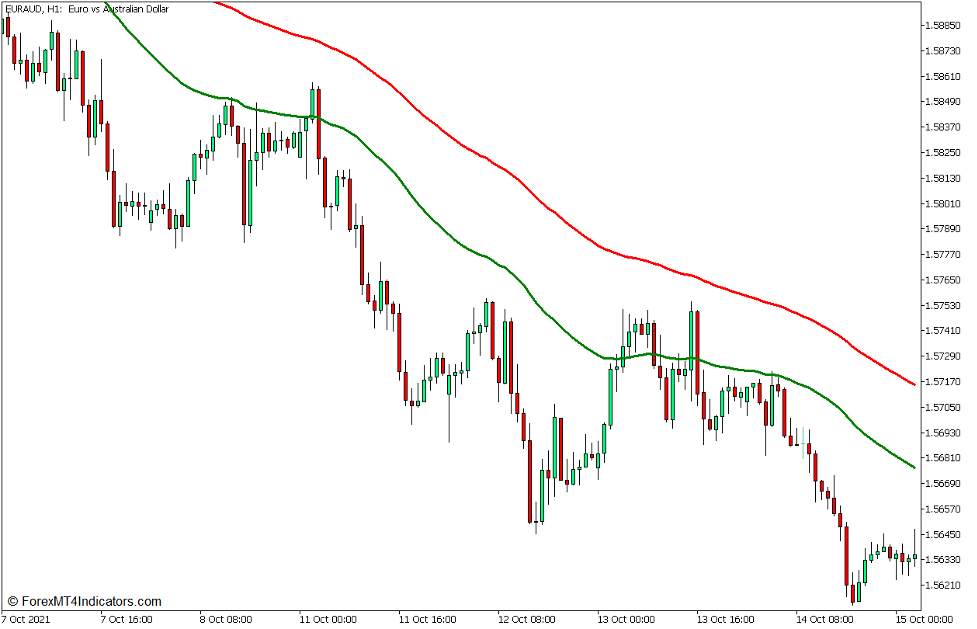
Most traders are familiar with the concept of support and resistance levels. However, the concept of a Dynamic Area of Support and Resistance might be new to some.
If you would observe price action and market structures along with some moving average lines, you would notice that price typically bounces off around the area near a moving average line. This is typically the case for when the market is pulling back during a trending market condition.
Dynamic Area of Support and Resistance are areas which may act as support and resistance levels that are not static or fixed in one level or line. Instead, this type of support and resistance would dynamically vary and move depending on the movements of price action. It is also often based on a pair or a set of moving average lines, which are inherently support and resistance levels where the market may reverse from. Traders may observe for potential market reversals on the area between two moving average lines. The direction of the support or resistance is based on where the faster line is in relation to the slower line. The area is a support area if the faster moving average is above the slower moving average. Inversely, it is a resistance area if the faster moving average line is below the slower moving average line. If price action breaches the slower moving average line with strong momentum, traders may consider the possibility that the market is starting to reverse to the opposite trend direction.
Below is an example of the 50 EMA and 100 EMA lines acting as a Dynamic Area of Resistance on a downtrend market.
Trading Strategy Concept
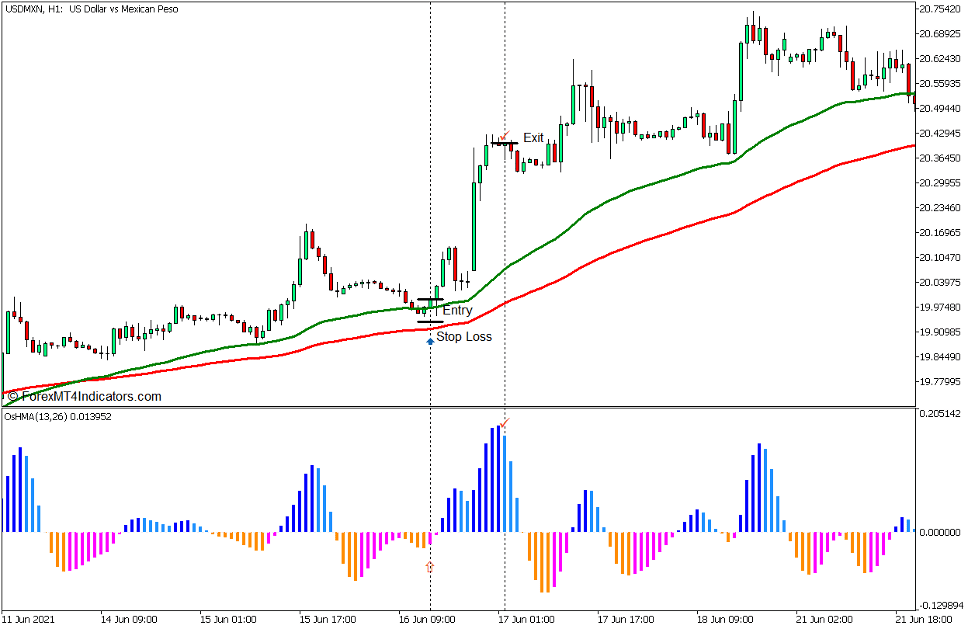
OsHMA Dynamic Trend Continuation Forex Trading Strategy is a trend continuation strategy which uses the 50 Exponential Moving Average (EMA) and the 100 EMA lines as a basis for its Dynamic Area of Support or Resistance.
Traders may identify and confirm the trend direction based on the location of the 50 EMA line in relation to the 100 EMA line. We would then anticipate for market pullbacks or consolidation phases on the area between the 50 EMA and 100 EMA lines.
As soon as price action touches or enters the area between the 50 EMA and 100 EMA lines, traders may start to observe for possible momentum reversals.
We will be using the OsHMA Indicator to identify the momentum reversal. The entry signal will be based on the color change of the OsHMA bars indicating the momentum reversal.
Buy Trade Setup
Entry
- The 50 EMA line (green) should be above the 100 EMA line (red).
- Allow price to pull back to the area between the 50 EMA and 100 EMA lines.
- Open a buy order as soon as the OsHMA bars changes to magenta.
Stop Loss
- Set the stop loss below the entry candle.
Exit
- Allow price to rally above the swing high and then close the trade as soon as the OsHMA bars changes to dodger blue.
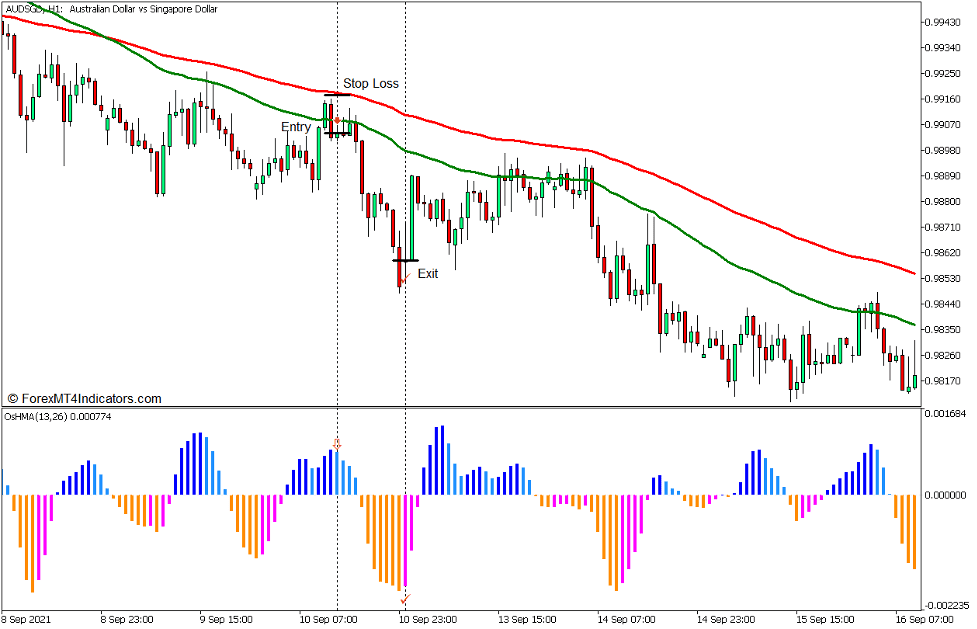
Sell Trade Setup
Entry
- The 50 EMA line (green) should be below the 100 EMA line (red).
- Allow price to pull back to the area between the 50 EMA and 100 EMA lines.
- Open a sell order as soon as the OsHMA bars changes to dodger blue
Stop Loss
- Set the stop loss above the entry candle.
Exit
- Allow price to drop below the swing low and then close the trade as soon as the OsHMA bars changes to magenta.
Conclusion
Trend continuation strategies using a Dynamic Area of Support or Resistance is an effective way to trade the market especially when used in the right market scenario. This strategy just simplifies the process of trading such type of strategy by providing an objective trade entry signal using the OsHMA Indicator.
Although this strategy can be an effective way to trade the market, it is still best used in conjunction with a proper understanding of market structure.
Recommended MT5 Brokers
XM Broker
- Free $50 To Start Trading Instantly! (Withdraw-able Profit)
- Deposit Bonus up to $5,000
- Unlimited Loyalty Program
- Award Winning Forex Broker
- Additional Exclusive Bonuses Throughout The Year

>> Sign Up for XM Broker Account here <<
FBS Broker
- Trade 100 Bonus: Free $100 to kickstart your trading journey!
- 100% Deposit Bonus: Double your deposit up to $10,000 and trade with enhanced capital.
- Leverage up to 1:3000: Maximizing potential profits with one of the highest leverage options available.
- ‘Best Customer Service Broker Asia’ Award: Recognized excellence in customer support and service.
- Seasonal Promotions: Enjoy a variety of exclusive bonuses and promotional offers all year round.

>> Sign Up for FBS Broker Account here <<
Click here below to download: