


Market reversals can be identified based on price action and price patterns. This is often the method used by most seasoned traders. However, newer traders usually find it daunting to identify possible trend reversals based on their observations.
Let us look into how we can use technical indicators, such as the Elliott Wave Oscillator and the Highest Highs – Lowest Lows SR indicator, to help us objectively identify and confirm what price action is doing. The strategy discussed here shows us a trend reversal strategy based on the two indicators, which agrees with the concepts of a trend reversal based on price action.
Elliott Wave Oscillator Indicator
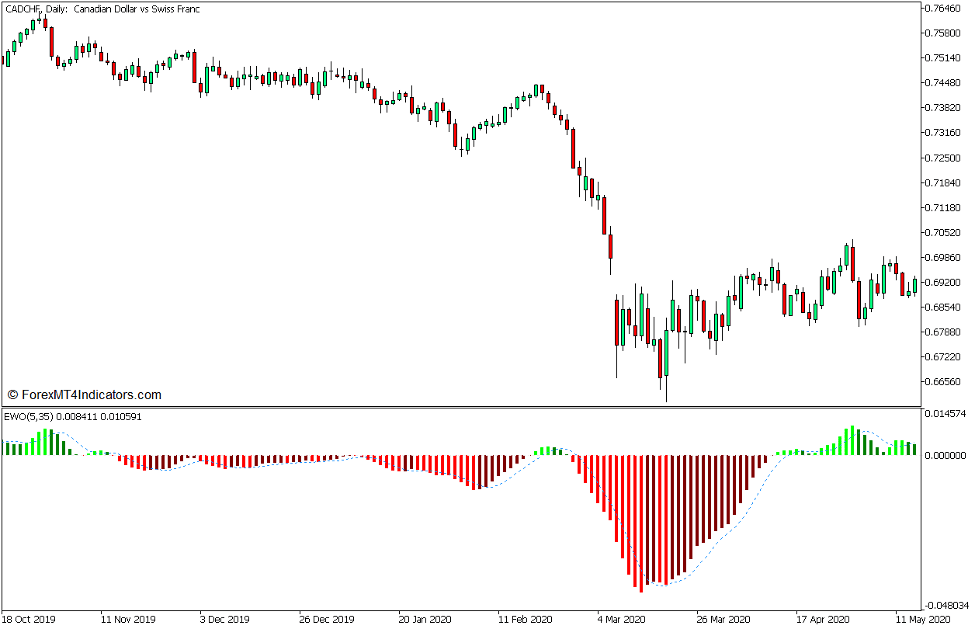
The Elliott Wave Oscillator (EWO) is a momentum indicator which was developed based on the Elliott Wave Theory. Ralph Nelson Elliot, the author of the Elliott Wave Theory, observed that prices move based on general patterns. The theory suggests that traders can anticipate the direction of the next price movement based on patterns and where price action is in relation to the identified patterns. Although the patterns are repeatable, market noise such as price spikes and volatility could often mislead traders resulting in mistimed reversal signals. For this reason, Elliott developed the EWO to help traders objectively identify the market swings and reversals as it allows traders to track and observe price oscillations while comparing it to the oscillations on the EWO bars.
The EWO indicator uses two moving average lines to calculate for the values that it plots, particularly the 5-bar Simple Moving Average (SMA) and the 34-bar SMA. Using the values of the two SMA lines, it calculates for the difference between the 5 SMA and 34 SMA lines. It then uses these values as a basis for plotting its histogram bars. Thus the main formula for the EWO indicator is as follows:
EWO = 5 SMA – 34 SMA
This version of the EWO modifies the color of the bars to indicate the direction of the trend, as well as the weakening or strengthening of the trend. It plots lime bars whenever it is printing positive values which have greater value than its preceding bar, and green bars whenever it is printing positive bars with decreasing values. On the other hand, it plots red bars whenever it is printing negative bars with decreasing values, and maroon bars whenever it is printing negative bars with positive values.
This version also has a feature wherein the indicator would calculate for the moving average of the EWO bars. It then plots the values of the moving average as a dashed line which mimics the movements of the oscillator bars. This dashed line may be used as a signal line.
Highest High – Lowest Low SR Indicator
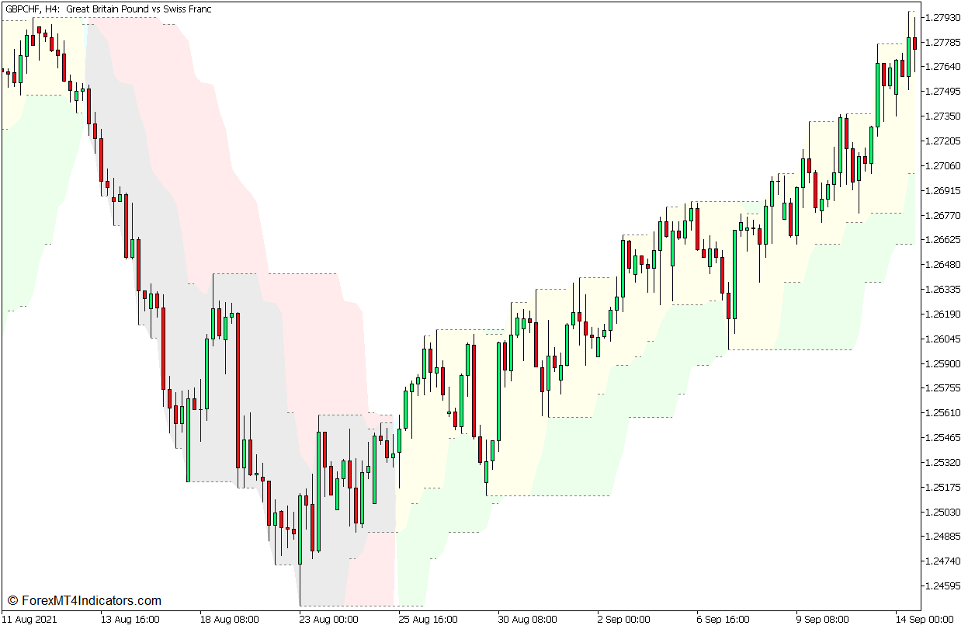
The Highest High – Lowest Low SR Indicator is a custom technical indicator which was intended to help traders identify support and resistance levels, as well as trend direction based on price action.
The initials “SR” actually mean “support and resistance”. As its name suggests, the Highest High – Lowest Low SR Indicator is a tool which identifies support and resistance levels based on the highest highs and lowest lows. The indicator uses an algorithm which compared the highs and lows of price in order to identify the highest highs and lowest lows in a series of candles. The identified highest highs and lowest lows are then used as a basis for plotting dotted lines, which are the identified support and resistance levels.
Incidentally, given that price action can be used to identify trend direction, this indicator also has a feature which helps traders identify trend direction. It shades the area between the support and resistance levels yellow and green to indicate a bullish trend, and violet and pink to indicate a bearish trend. This trend direction is based on price action breaking higher highs indicating an uptrend or dropping below lower lows indicating a downtrend.
Trading Strategy Concept
Elliott Wave Oscillator Reversal Breakout Forex Trading Strategy is a trend reversal trading strategy which is based on the Higher Highs – Lower Lows SR and Elliott Wave Oscillator indicators.
The Higher Highs – Lowers Lows SR indicator is used to identify the reversal of price swings. This is based on the concept that trend direction can be identified based on price action breaking higher highs or dropping below lower lows. To do this, we would be observing for candles with strong momentum closing strongly beyond an identified support or resistance level moving against the direction of the current trend. This action would also cause the indicator to shade its areas with a different color indicating a potential trend reversal.
The Elliott Wave Oscillator is then used as a confirmation signal of the identified potential trend reversal. Trend direction and strength is identified based on whether its histogram bars are positive or negative, as well as the color of the bars it plots.
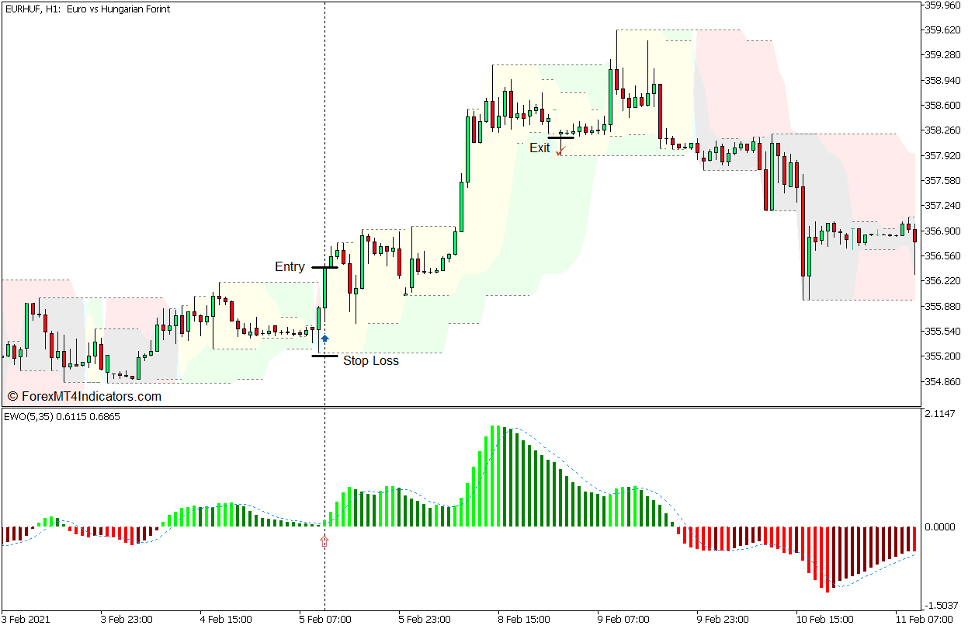
Buy Trade Setup
Entry
- A strong bullish momentum candle should close above a major swing high resistance identified by the Higher Highs – Lower Lows SR indicator.
- The Elliott Wave Oscillator should plot a positive lime bar which is above its signal line.
- Open a buy order on the confirmation of these conditions.
Stop Loss
- Set the stop loss below the support level identified by the Higher Highs – Lower Lows SR indicator.
Exit
- Trail the stop loss one or two support levels behind price action until stopped out in profit.
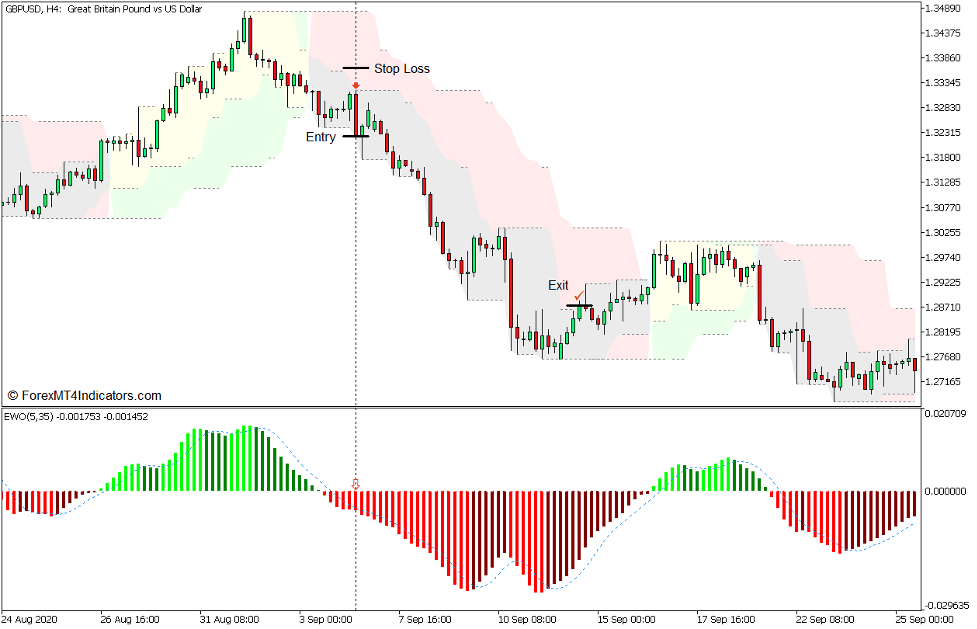
Sell Trade Setup
Entry
- A strong bearish momentum candle should close below a major swing low support identified by the Higher Highs – Lower Lows SR indicator.
- The Elliott Wave Oscillator should plot a negative red bar which is below its signal line.
- Open a sell order on the confirmation of these conditions.
Stop Loss
- Set the stop loss above the resistance level identified by the Higher Highs – Lower Lows SR indicator.
Exit
- Trail the stop loss one or two support levels behind price action until stopped out in profit.
Conclusion
Identifying trend reversals based on the break of a swing high or swing low is an effective method for spotting trend reversals. This strategy simplifies the process of identifying such reversal signals using technical indicators, resulting in reversal trade signals that are objective and logical.
This strategy works best with the understanding of price action and its trend reversal signals. Traders who can spot support and resistance levels based on swing highs and lows would also be more effective in trading this type of strategy.
Recommended MT5 Brokers
XM Broker
- Free $50 To Start Trading Instantly! (Withdraw-able Profit)
- Deposit Bonus up to $5,000
- Unlimited Loyalty Program
- Award Winning Forex Broker
- Additional Exclusive Bonuses Throughout The Year

>> Sign Up for XM Broker Account here <<
FBS Broker
- Trade 100 Bonus: Free $100 to kickstart your trading journey!
- 100% Deposit Bonus: Double your deposit up to $10,000 and trade with enhanced capital.
- Leverage up to 1:3000: Maximizing potential profits with one of the highest leverage options available.
- ‘Best Customer Service Broker Asia’ Award: Recognized excellence in customer support and service.
- Seasonal Promotions: Enjoy a variety of exclusive bonuses and promotional offers all year round.

>> Sign Up for FBS Broker Account here <<
Click here below to download: