


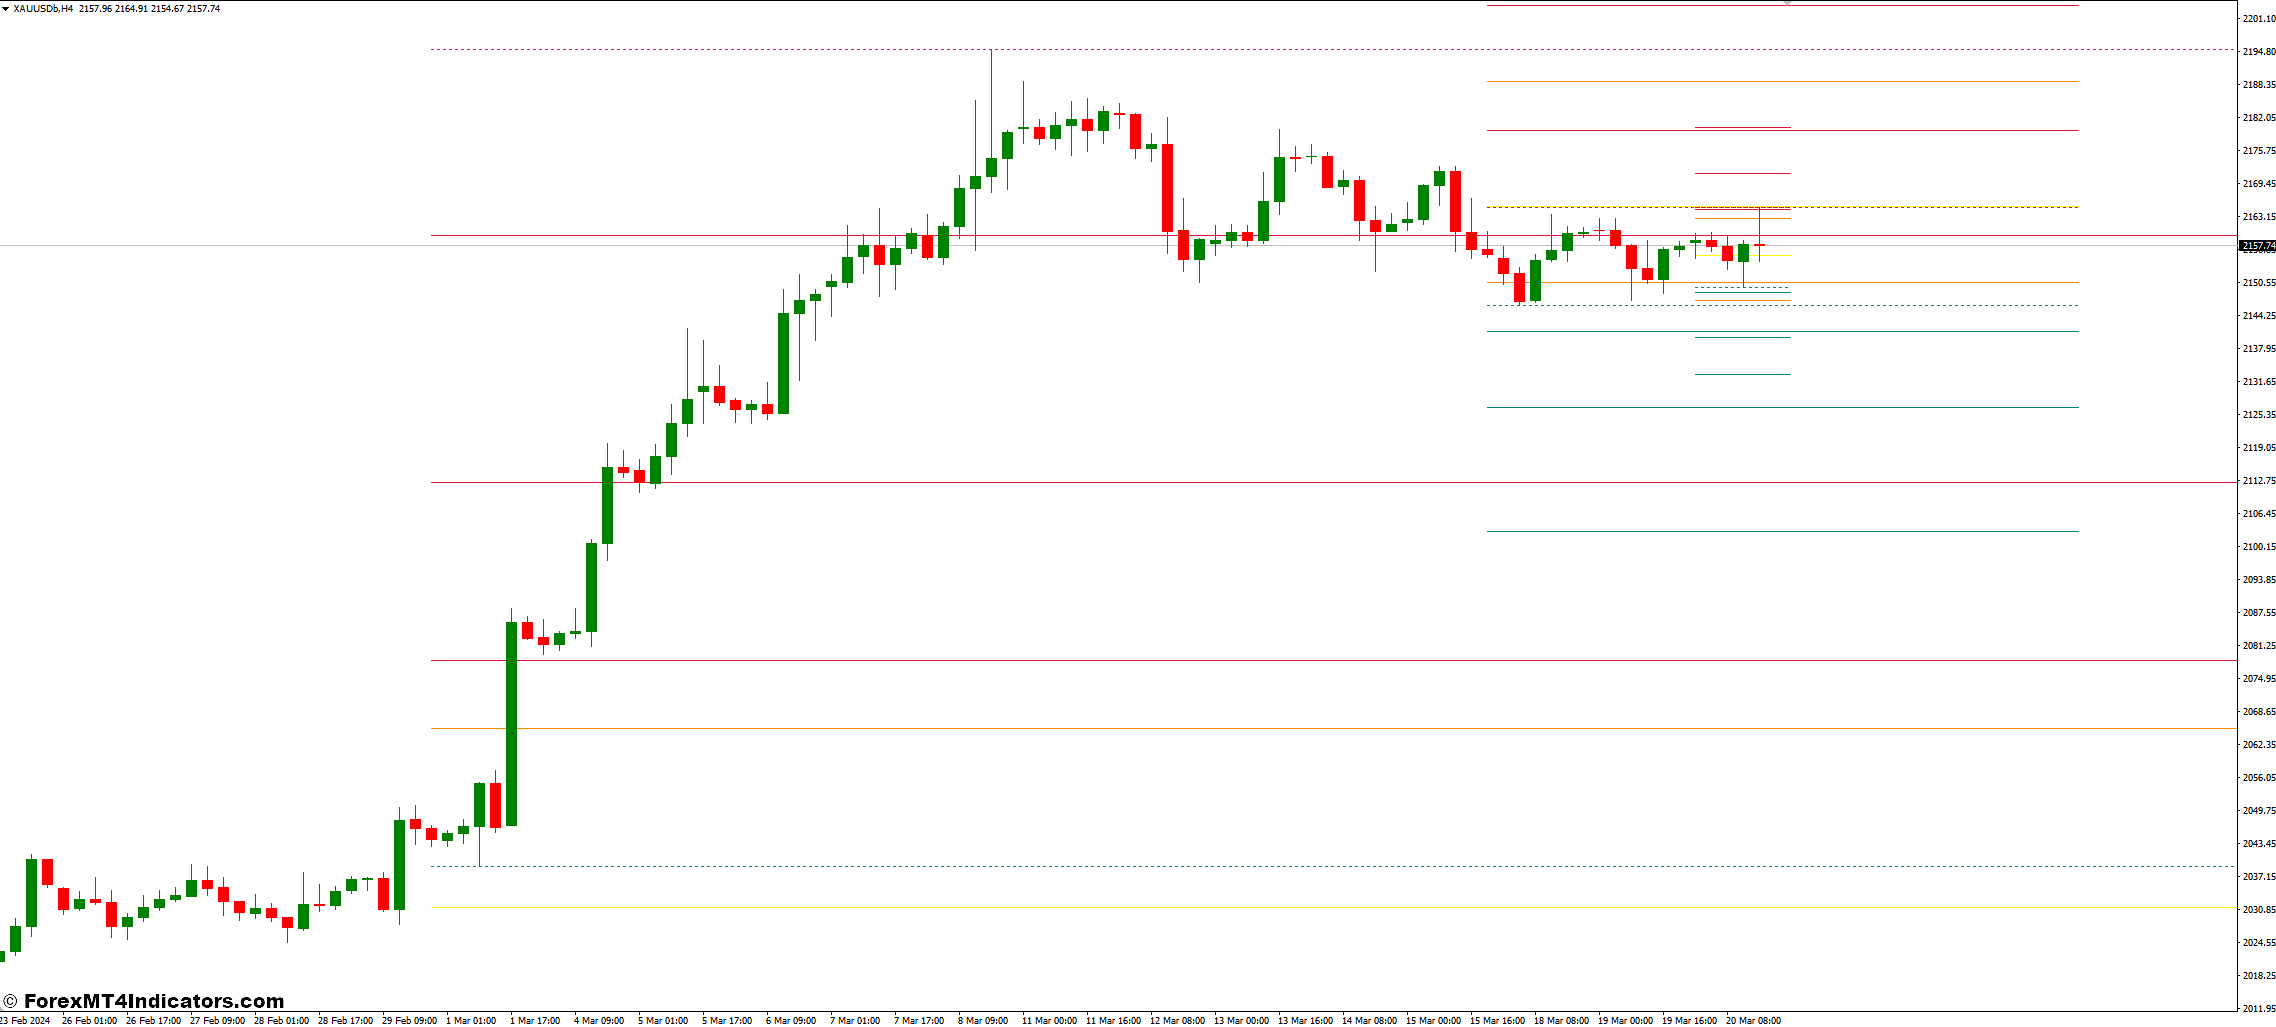
Pivot points are a technical analysis tool that identifies potential support and resistance levels within a specific timeframe. These levels are derived from a mathematical formula that considers the previous period’s High (H), Low (L), and Close (C) prices. Imagine them as signposts on a financial highway, indicating areas where price action might pause or reverse.
Understanding Support and Resistance Levels
Support and resistance are fundamental concepts in technical analysis. Support refers to price zones where buying pressure is likely to be strong, potentially halting or reversing a price decline. Conversely, resistance represents areas where selling pressure might intensify, potentially hindering price advances. Pivot points, along with the calculated support (S1, S2, S3) and resistance (R1, R2, R3) levels, provide a framework for identifying these crucial zones.
Demystifying Daily HiLo Pivot Points
Now, let’s delve into the specifics of Daily HiLo Pivot Points.
The formula for Calculating Daily Pivot Points
The formula for calculating the Daily Pivot Point (PP) is as follows:
PP = (High (previous day) + Low (previous day) + Close (previous day)) / 3
Once you have the PP, you can calculate the support and resistance levels using these formulas:
Resistance Levels
- R1 = 2 * PP – Low (previous day)
- R2 = PP + (High (previous day) – Low (previous day))
- R3 = High (previous day) + 2 * (PP – Low (previous day))
Support Levels
- S1 = 2 * PP – High (previous day)
- S2 = PP – (High (previous day) – Low (previous day))
- S3 = Low (previous day) – 2 * (High (previous day) – PP)
Unlocking Weekly and Monthly HiLo Pivot Points
The magic of HiLo Pivot Points extends beyond the daily timeframe.
Distinguishing Between Daily, Weekly & Monthly Calculations
The core calculation principles remain similar for weekly and monthly pivot points. However, the timeframe for considering the High, Low, and Close prices changes. For weekly pivot points, we consider the previous week’s data, while for monthly calculations, we use the prior
Advantages of Using Multi-Timeframe Analysis
Employing a multi-timeframe approach, which incorporates daily, weekly, and monthly pivot points, fosters a more comprehensive understanding of market dynamics. It allows you to zoom in for short-term trading opportunities while maintaining awareness of the bigger picture. This holistic approach can potentially lead to more informed trading decisions.
Trading Strategies with HiLo Pivot Points
Now that you’re armed with the knowledge of HiLo Pivot Points and their customization options, let’s explore some practical trading strategies:
Price Breakouts Above/Below Pivot Points
A breakout above the pivot point (PP) signifies a potential bullish trend. You could consider entering a long position (buying) if the price convincingly surpasses a resistance level (R1, R2, R3) and other technical indicators support the uptrend. Conversely, a breakdown below the PP suggests a possible bearish scenario. A short position (selling) might be an option if the price decisively breaches a support level (S1, S2, S3) with confirmation from other indicators.
Price Reversals at Support and Resistance Levels
Price action around support and resistance zones is often dynamic. If the price approaches a support level (S1, S2, S3) and bounces back upwards, it might indicate buying pressure and a potential trend reversal. Conversely, a price nearing a resistance level (R1, R2, R3) and exhibiting a reversal downwards could suggest selling pressure and a potential trend shift.
Advantages and Limitations of HiLo Pivot Points
As with any technical analysis tool, HiLo Pivot Points come with both advantages and limitations:
Advantages of Using HiLo Pivot Points
- Simplicity: The calculations for pivot points are relatively straightforward, making them accessible to traders of all experience levels.
- Market Context: Pivot points provide valuable insights into potential support and resistance zones, offering a framework for understanding market sentiment.
- Customization: The ability to adjust the timeframe and number of support/resistance levels allows for personalization based on your trading style.
Drawbacks of Pivot Points
- Self-Fulfilling Prophecy: If a large number of traders rely heavily on pivot points, their trading decisions can influence price action, potentially creating a self-fulfilling prophecy.
- False Signals: Pivot points don’t guarantee future price movements. Price reversals or breakouts can occur outside the designated support/resistance zones, leading to false signals.
How To Trade With Daily Weekly Monthly HiLo Pivot Points Indicator
Buy Entry
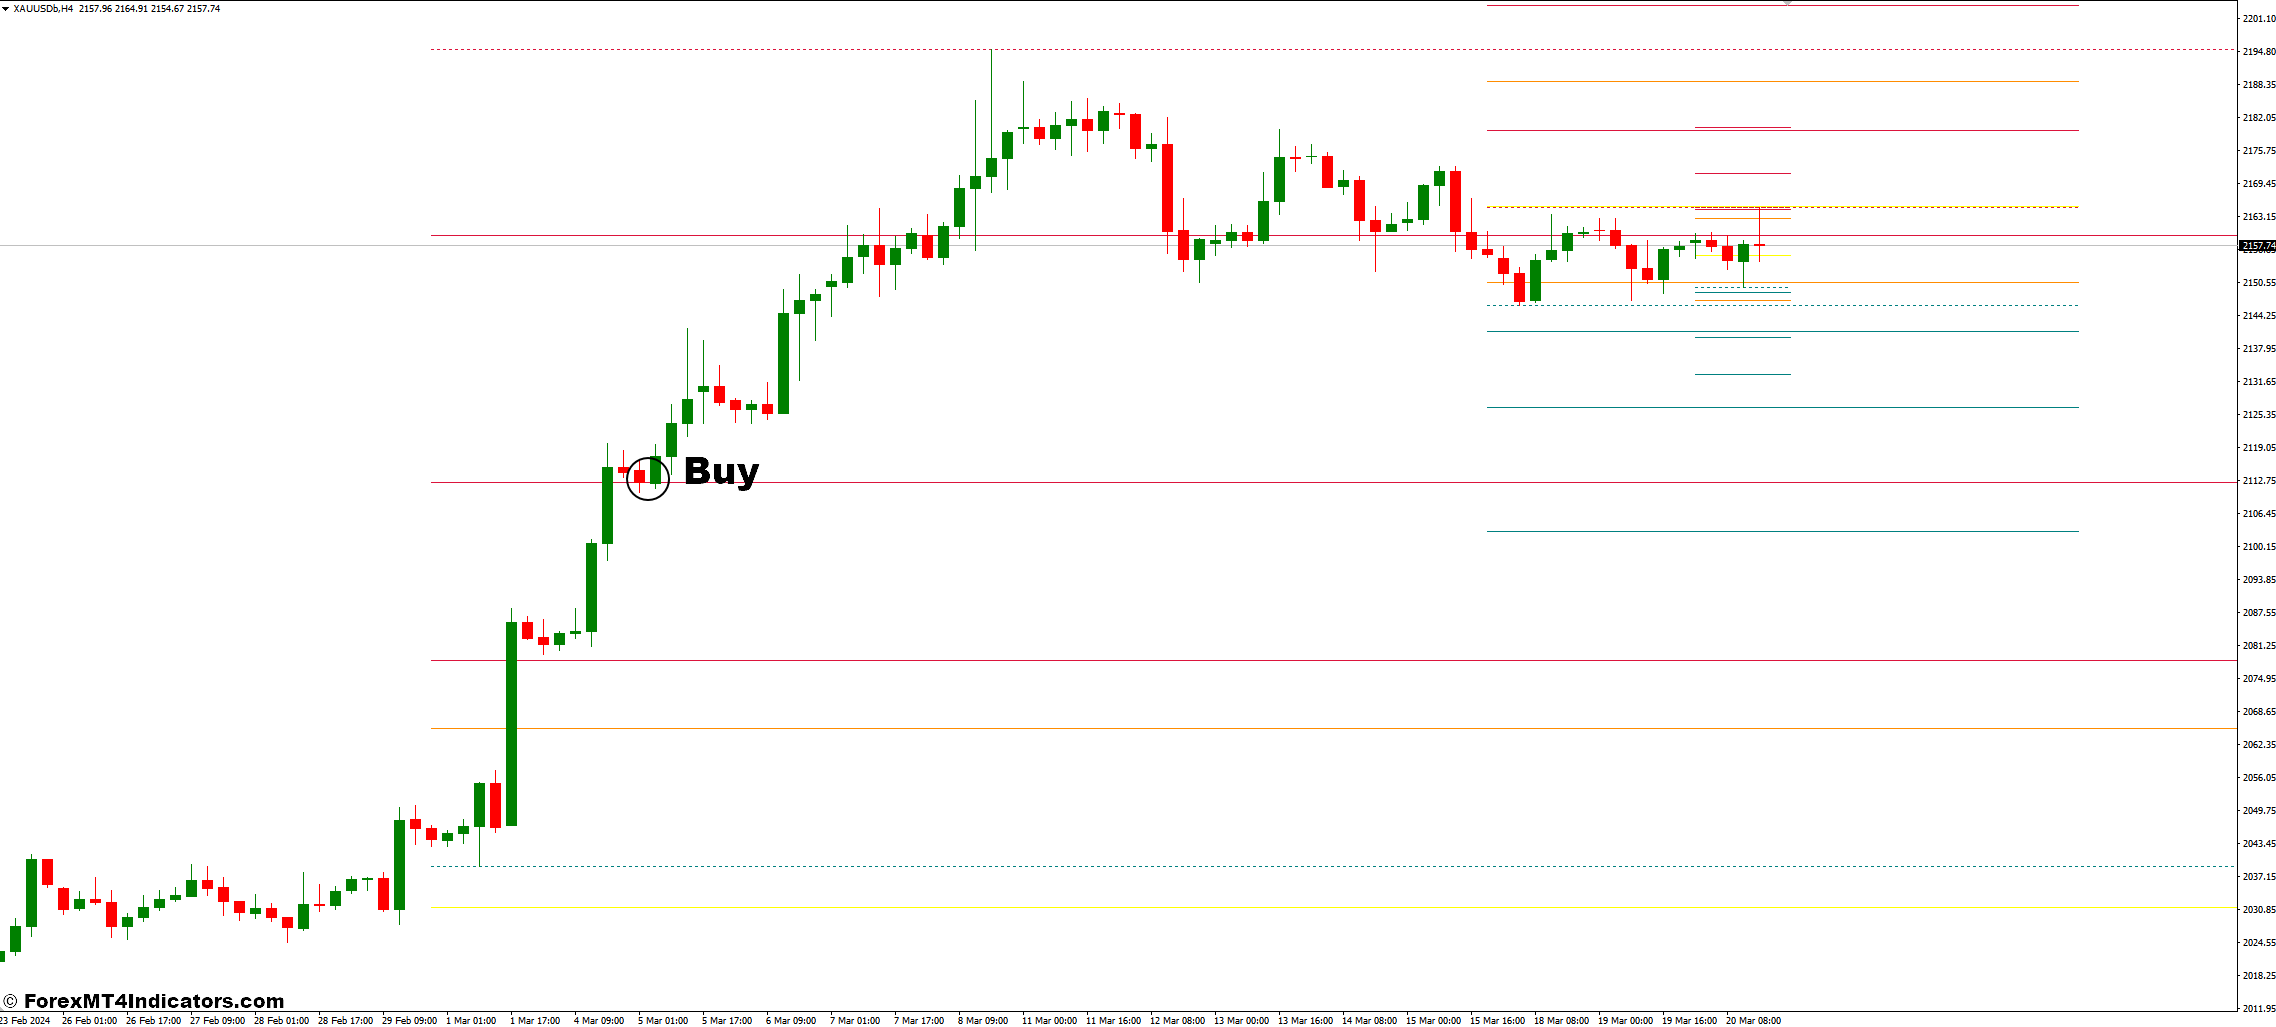
- Look for a price breakout above the Daily Pivot Point (PP) with strong bullish momentum (increasing volume).
- Consider a long position (buying) if the price convincingly surpasses a resistance level (R1, R2, R3).
- Confirmation: Ideally, this breakout should be accompanied by supporting signals from other technical indicators like a rising Moving Average or an RSI value below 70 (indicating not overbought).
Stop-Loss
- Place a stop-loss order below the nearest support level (S1 or S2) to limit potential losses if the price falls and breaks the bullish momentum.
Take-Profit
- Target profit-taking near the next resistance level (R2 or R3).
Sell Entry
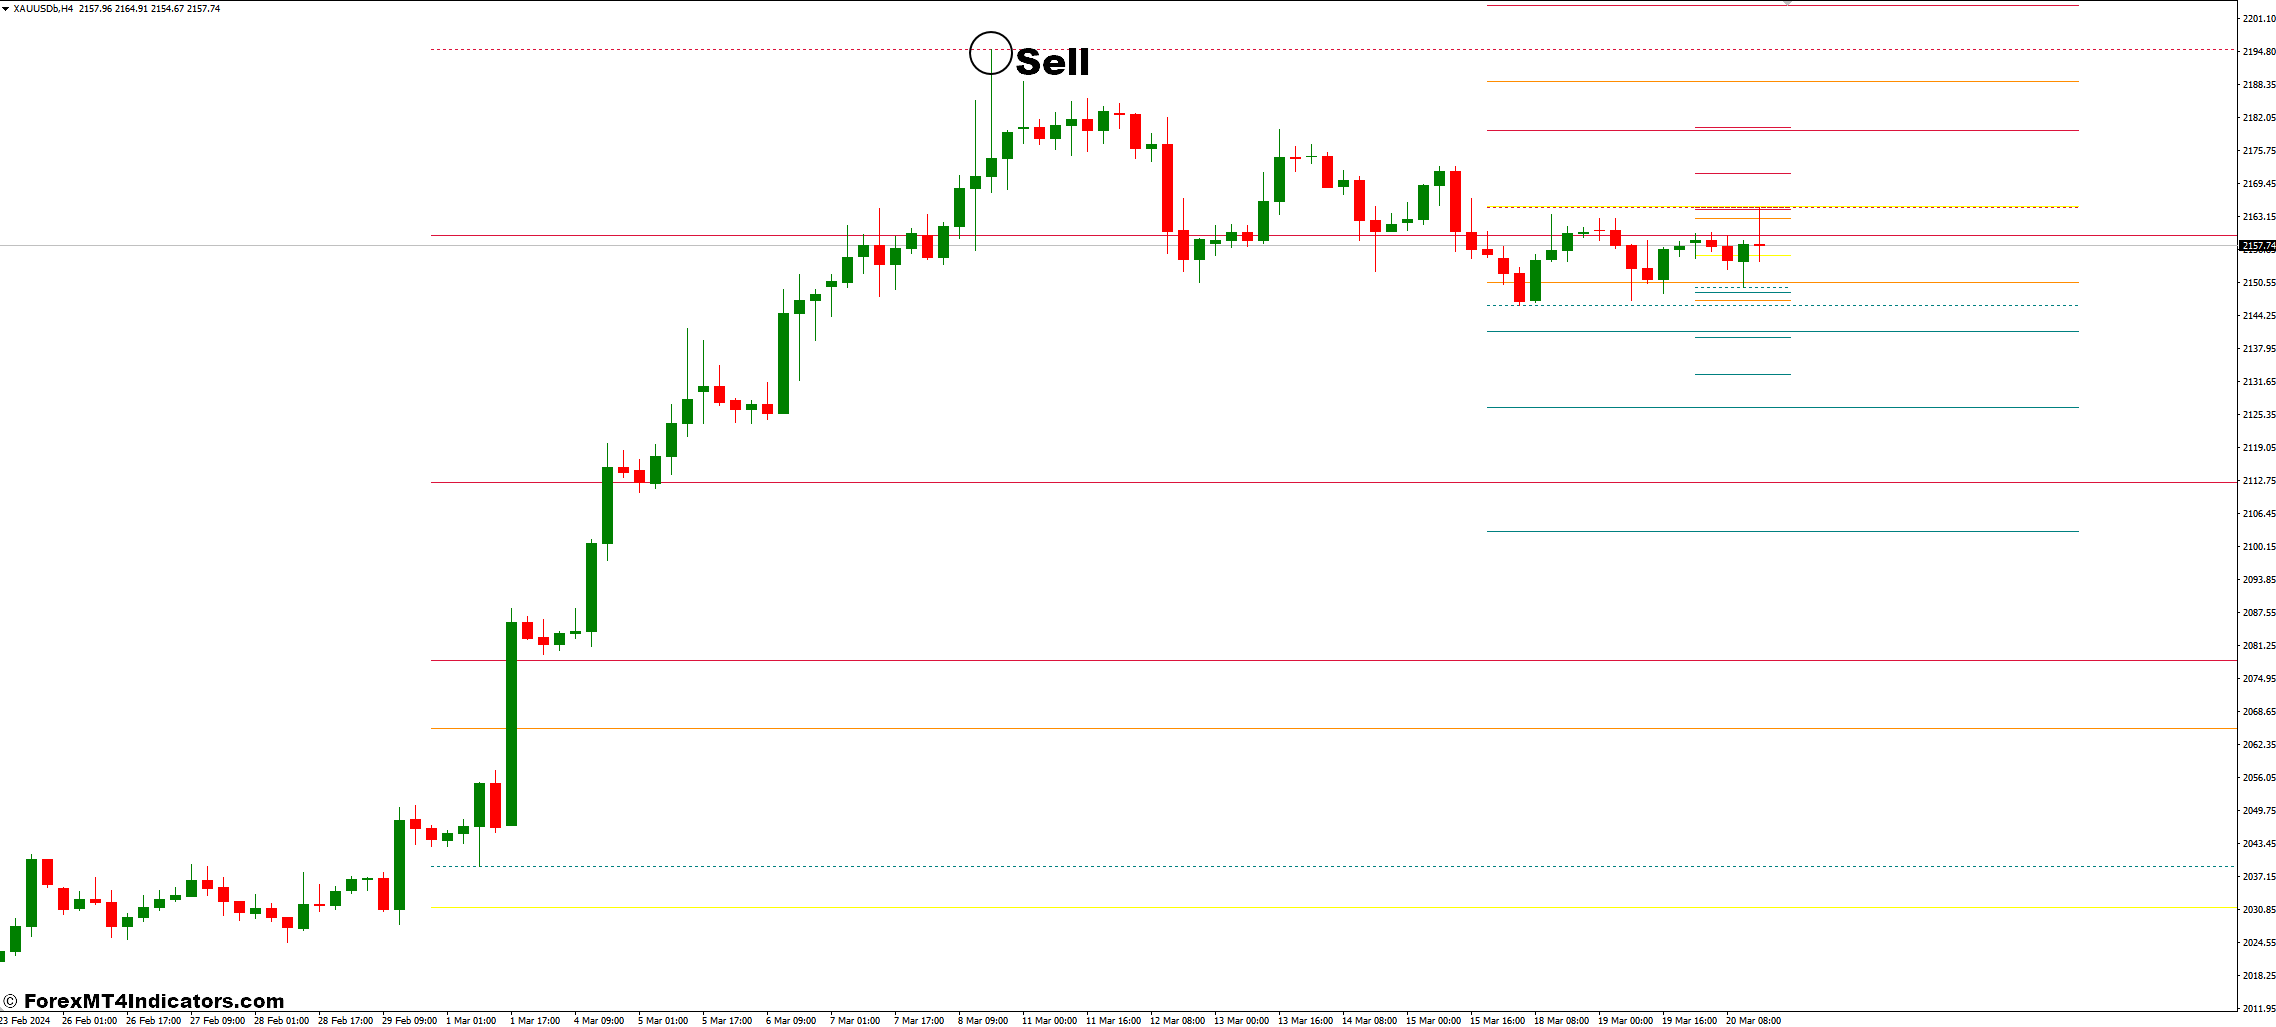
- Look for a price breakdown below the Daily Pivot Point (PP) with strong bearish momentum (increasing volume).
- Consider a short position (selling) if the price decisively breaches a support level (S1, S2, S3).
- Confirmation: Ideally, this breakdown should be accompanied by supporting signals from other technical indicators like a falling Moving Average or an RSI value above 70 (indicating overbought).
Stop-Loss
- Place a stop-loss order above the nearest resistance level (R1 or R2) to limit potential losses if the price rallies and breaks the bearish momentum.
Take-Profit
- Target profit-taking near the next support level (S2 or S3).
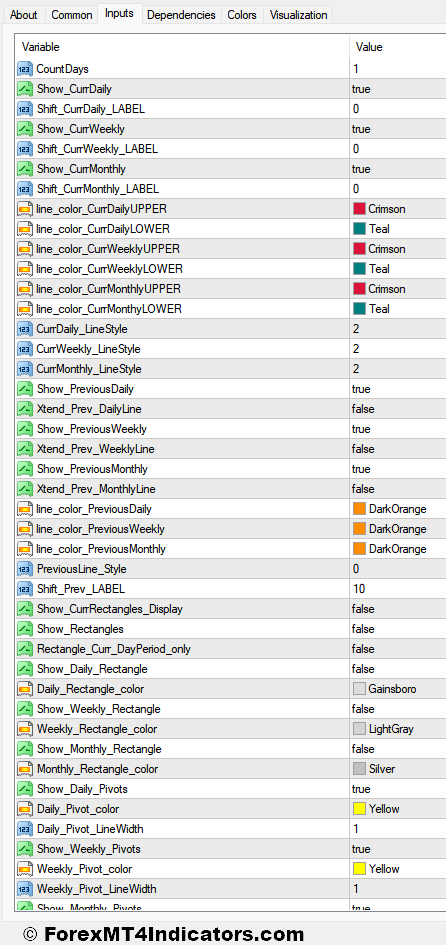
Daily Weekly Monthly HiLo Pivot Points Indicator Settings
Conclusion
HiLo Pivot Points, when used thoughtfully and in conjunction with other technical analysis tools and sound risk management practices, can empower you to make more informed trading decisions.
Recommended MT4/MT5 Brokers
XM Broker
- Free $50 To Start Trading Instantly! (Withdraw-able Profit)
- Deposit Bonus up to $5,000
- Unlimited Loyalty Program
- Award Winning Forex Broker
- Additional Exclusive Bonuses Throughout The Year

>> Sign Up for XM Broker Account here <<
FBS Broker
- Trade 100 Bonus: Free $100 to kickstart your trading journey!
- 100% Deposit Bonus: Double your deposit up to $10,000 and trade with enhanced capital.
- Leverage up to 1:3000: Maximizing potential profits with one of the highest leverage options available.
- ‘Best Customer Service Broker Asia’ Award: Recognized excellence in customer support and service.
- Seasonal Promotions: Enjoy a variety of exclusive bonuses and promotional offers all year round.

>> Sign Up for FBS Broker Account here <<

(Free MT4 Indicators Download)
Click here below to download: