


Mean reversal trading strategies using a band or channel type of technical indicator is one of the most basic ways many traders trade the market. It is a simple trading method which assumes that price is either too high or too low as it reaches certain price levels using a band type of technical indicator.
GRF Leading Edge Indicator
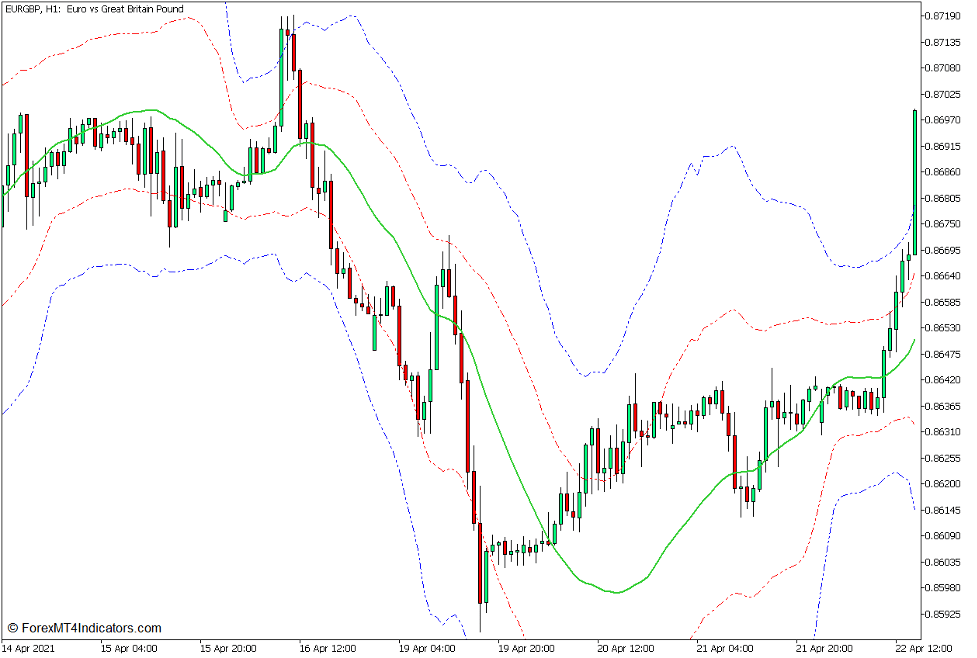
The GRF Leading Edge Indicator is a band or channel type of technical indicator which indicates the distance between the current price and the average price of a tradeable instrument.
This indicator is somewhat similar to other band type of indicators such as the Bollinger Bands, Donchian Channel, or Keltner Channel. However, the GRF Leading Edge Indicator is somewhat unique because it modifies its formula for calculating for the average price and its standard deviations. This creates a channel like structure which is distinct from the other above mentioned band type of indicators.
The GRF Leading Edge Indicator plots five lines. The middle line represented by a solid lime green line indicates the average price or the mean. Immediately above and below the middle line are two red dot-dot-dash lines. These two lines are deviations from the middle line displaced by two standard deviations from the average price. The outer lines represented by two blue dot-dot-dash lines are also deviations from the average price calculated as four standard deviations from the middle line.
Reversal Candlestick Patterns
Candlestick Patterns are recurring patterns which can be observed on a price chart especially when using a Japanese Candlestick type of charting. These patterns often indicate a possible market reversal which may develop right after the pattern.
Candlestick Patterns can be very effective tools for identifying possible market reversals. This is because candlestick patterns are indications of price rejection. It is somehow the market’s way of telling traders that it is uncomfortable with a certain price level. It could either be that the market views a price level as being too high or too low. As such, what usually follows is a market reversal.
There are several candlestick patterns that are highly effective and reliable. However, for the purpose of this discussion, we will only be showing two of the most basic yet effective reversal candlestick patterns – the Pin Bar and the Engulfing patterns.
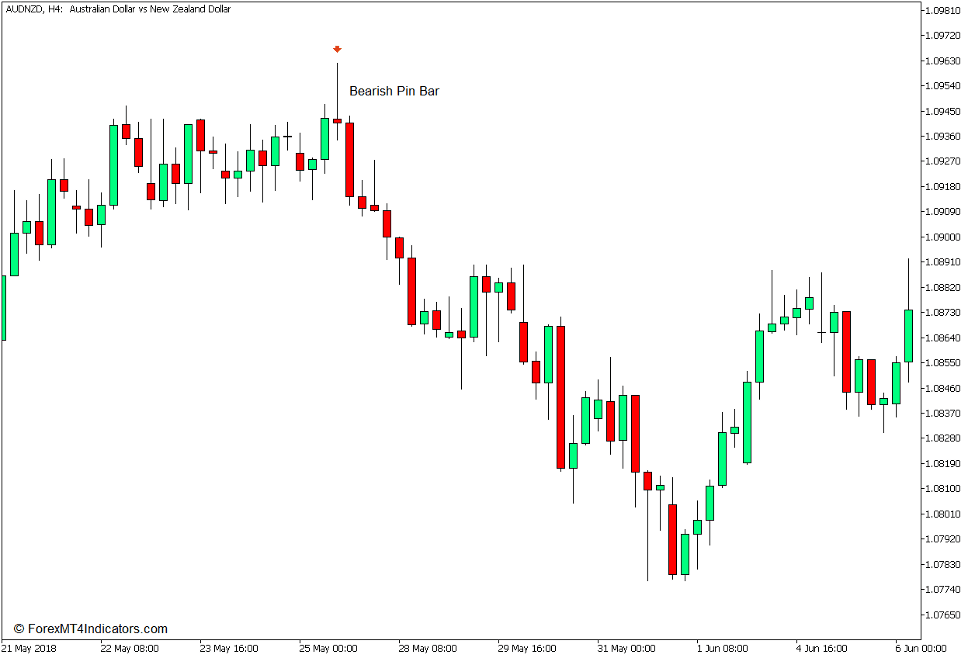
The Pin Bar Pattern is a candlestick pattern which consists of only one candle. It is a candle with a very small body, a long wick which could either be above or below the body, and a small wick on the opposite end of the candle. The long wick signifies price rejection. Imagine it as a leg of the candle kicking against an imaginary wall, which could be a support or resistance level. If the long wick is below the candle, then the pattern indicates a possible bullish reversal as it is pushing against the price level below the candle. On the other hand, if the long wick is above the candle, then the pin bar pattern is indicating a possible bearish reversal.
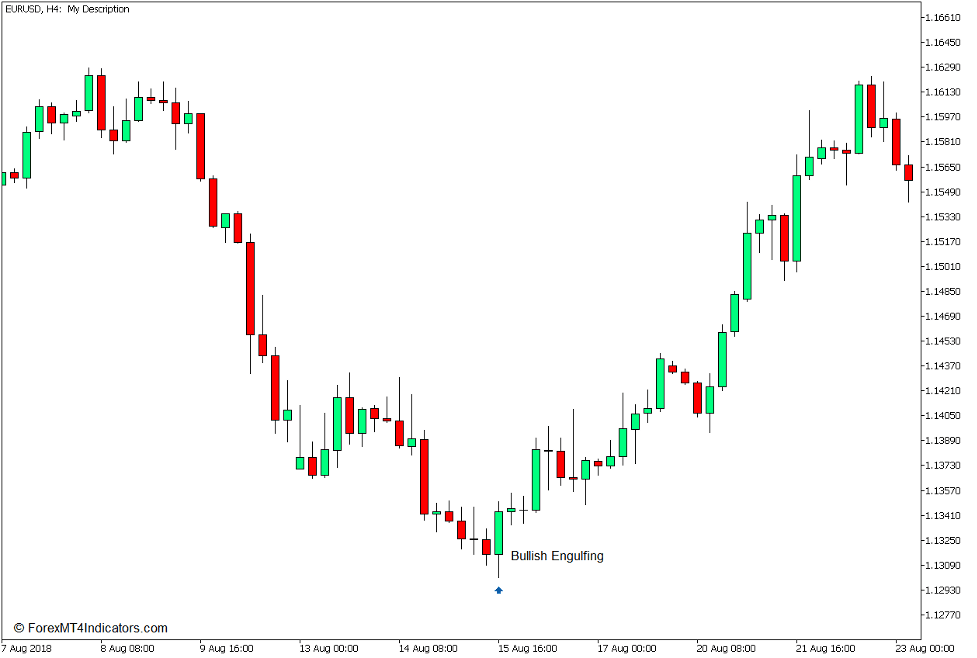
The Engulfing Pattern is a two candle pattern which also indicates a possible reversal. It is composed of two candles with a second candle having a body which completely engulfs the body of its preceding candle. Just like the pin bar pattern, the engulfing pattern also indicates a sudden reversal. This sudden reversal allows the second candle to completely reverse against the body of its preceding candle and completely engulf it. The direction of the reversal is indicated by the direction of the second candle. If the second candle is bullish, then the pattern indicates a possible bullish reversal. On the other hand, if the second candle is bearish, then the market is indicating a possible bearish reversal.
Trading Strategy Concept
GRF Leading Edge Mean Reversal Forex Trading Strategy for MT5 is a mean reversal type of strategy which is based on the GRF Leading Edge Indicator.
The GRF Leading Edge Indicator can be an excellent indicator for identifying oversold and overbought markets. Using the outer dot-dot-dash blue lines, traders can identify possible mean reversals coming from an oversold or overbought market. This is because price is technically too far from the average price. Traders can then observe for possible reversals coming from these price levels.
To identify the possible momentum reversals, traders can observe for reversal candlestick patterns like the pin bar and engulfing patterns. Imagine the outer blue lines as dynamic support and resistance levels where the reversal candlestick patterns can push against.
As for the exit, traders can opt to aim for the middle line, which is the mean, for a slightly conservative target, the opposing red or blue dot-dot-dash lines with the assumption of a strong price swing, or ride the reversal with the hopes that it would result in a strong momentum run. This strategy will be using the opposing red dot-dot-dash line for a slightly conservative target.
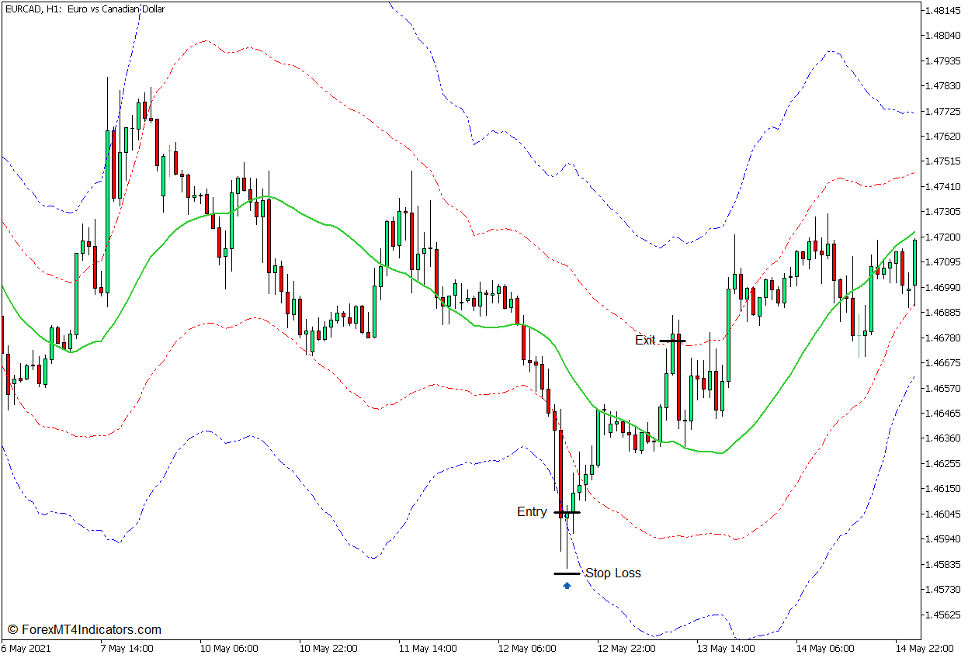
Buy Trade Setup
Entry
- Wait for the candlesticks to touch the lower blue dot-dot-dash line.
- Open a buy order either on a bullish pin bar or bullish engulfing candlestick pattern.
Stop Loss
- Set the stop loss below the reversal candlestick pattern.
Exit
- Close the trade as soon as price touches the upper red dot-dot-dash line.
Sell Trade Setup
Entry
- Wait for the candlesticks to touch the upper blue dot-dot-dash line.
- Open a sell order either on a bearish pin bar or bearish engulfing candlestick pattern.
Stop Loss
- Set the stop loss above the reversal candlestick pattern.
Exit
- Close the trade as soon as price touches the lower red dot-dot-dash line.

Conclusion
This type of trading strategy has been used with the other band or channel type of technical indicator quite effectively. This is because mean reversal signals coming from oversold or overbought markets tend to be high probability trading signals.
The GRF Leading Edge Indicator can also be a very effective mean reversal indicator as discussed above. This is because of the wider ranges that its bands accommodate.
Traders who opt to use this type of strategy should study it first through back- and forward testing. It is also best to incorporate other entry signal confirmations as a confluence.
Recommended MT5 Brokers
XM Broker
- Free $50 To Start Trading Instantly! (Withdraw-able Profit)
- Deposit Bonus up to $5,000
- Unlimited Loyalty Program
- Award Winning Forex Broker
- Additional Exclusive Bonuses Throughout The Year

>> Sign Up for XM Broker Account here <<
FBS Broker
- Trade 100 Bonus: Free $100 to kickstart your trading journey!
- 100% Deposit Bonus: Double your deposit up to $10,000 and trade with enhanced capital.
- Leverage up to 1:3000: Maximizing potential profits with one of the highest leverage options available.
- ‘Best Customer Service Broker Asia’ Award: Recognized excellence in customer support and service.
- Seasonal Promotions: Enjoy a variety of exclusive bonuses and promotional offers all year round.

>> Sign Up for FBS Broker Account here <<
Click here below to download: