


Using Fibonacci Ratio Based With Pivot Point Support & Resistance
Fibonacci Ratios have been proven time and time again to be an excellent tool for forex trading. Many have earned from it and made their fortune, retail and professional traders alike. Pivot Point Support and Resistance is also a great tool for trading. In fact, many professional institutional traders use it, due to its objectivity and the fact that it is based on a mathematical formula. I have an idea! Why not use both at the same time, in one strategy, using the same indicator. Is this possible? Yes! How? We could use the Fibonacci Ratios as part of the formula for Pivot Points. Don’t worry, we will not be getting our calculators and doing the computation ourselves. Heck, we don’t even need algebra for this. All we need is our handy-dandy indicator.
This is how it would look like in our MT4 trading platforms.
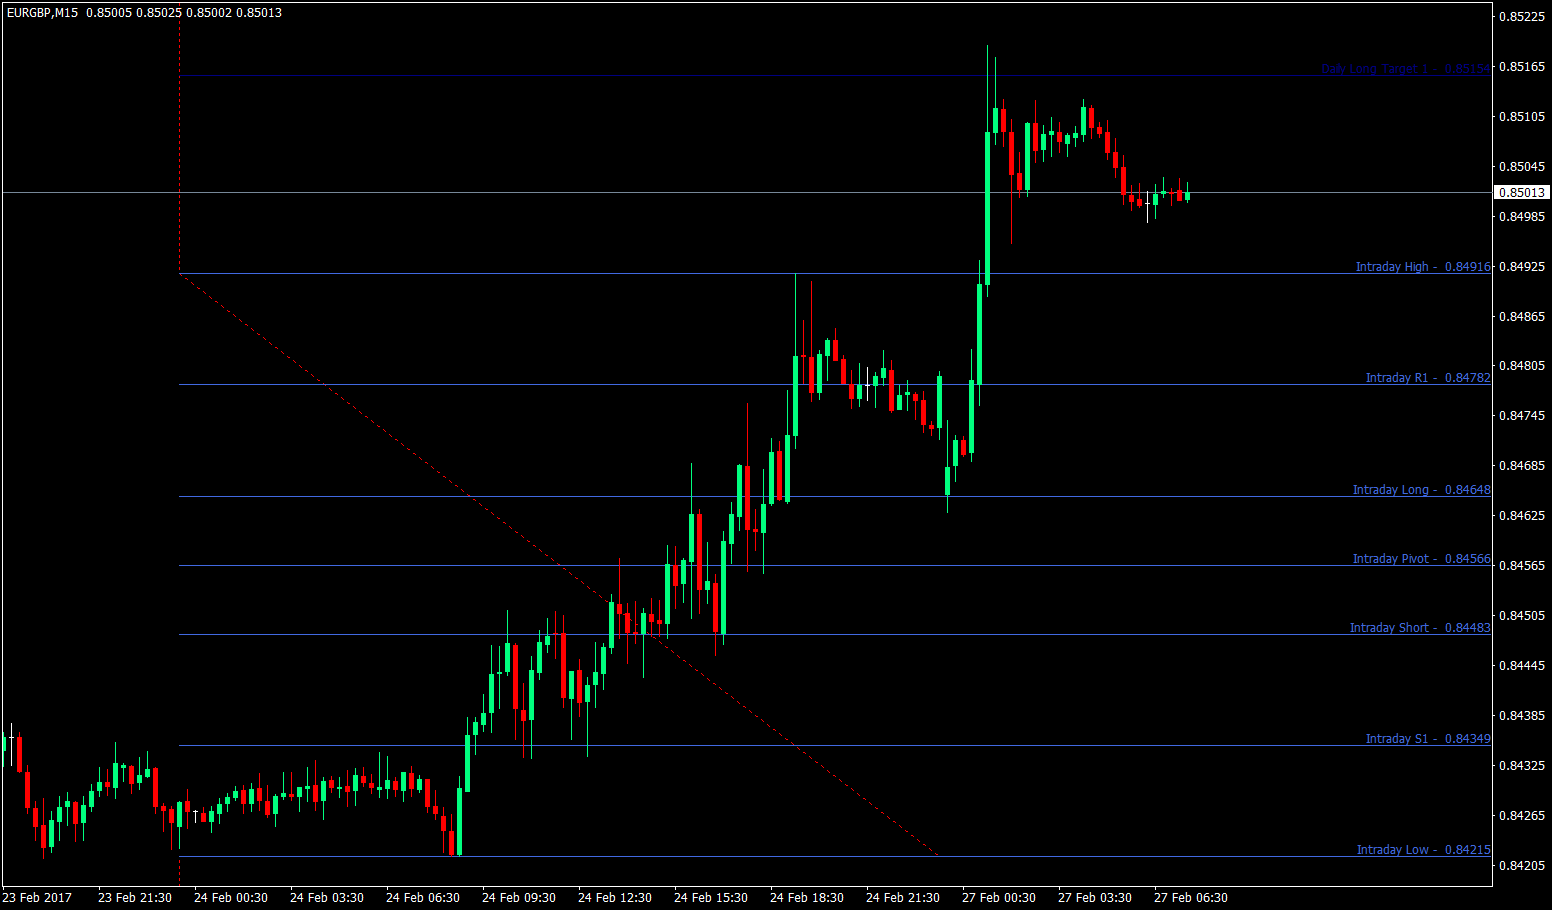
So, what does those lines mean? And how could they make money for me?
Basically, those lines are mathematically calculated Pivot Points using the Fibonacci Ratios. They would serve as horizontal supports and resistances, which will be the basis for our trade. Notice how price methodically challenges, respects and bounces off or breaks areas near those levels? This is why Fibonacci based Pivot Points are very powerful. It allows us to use the magic and accuracy of Fibonacci Ratios while allowing us to be on point by using a mathematical formula. The advantage of using this indicator is that it removes the subjectivity of deciding which would be our supports and resistances.
Now let’s dive in to how we should be trading this.
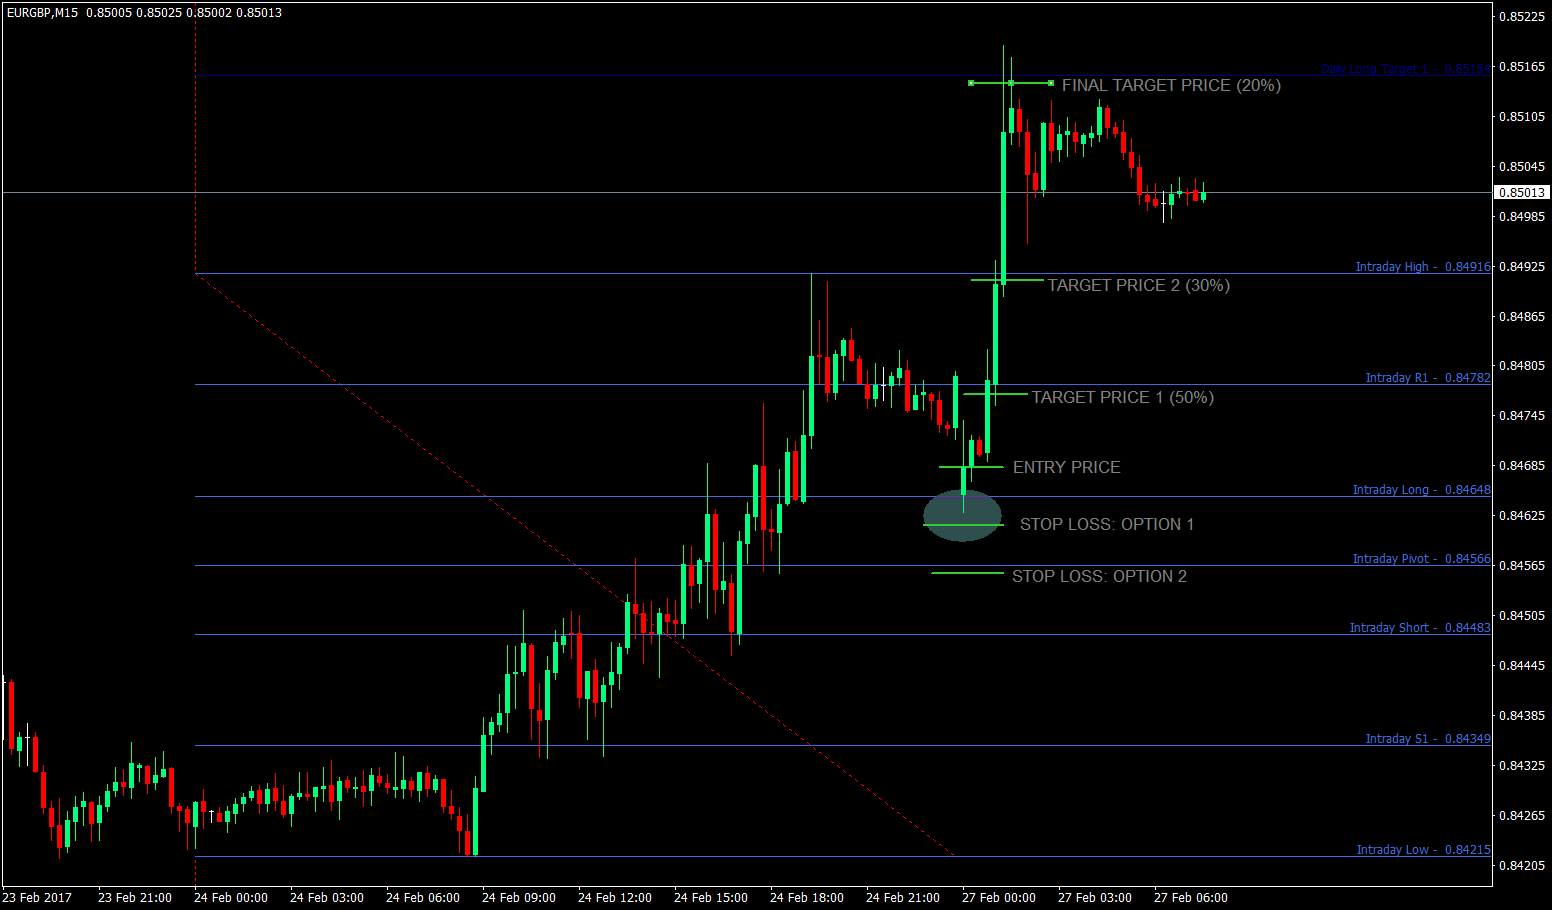
The Entry
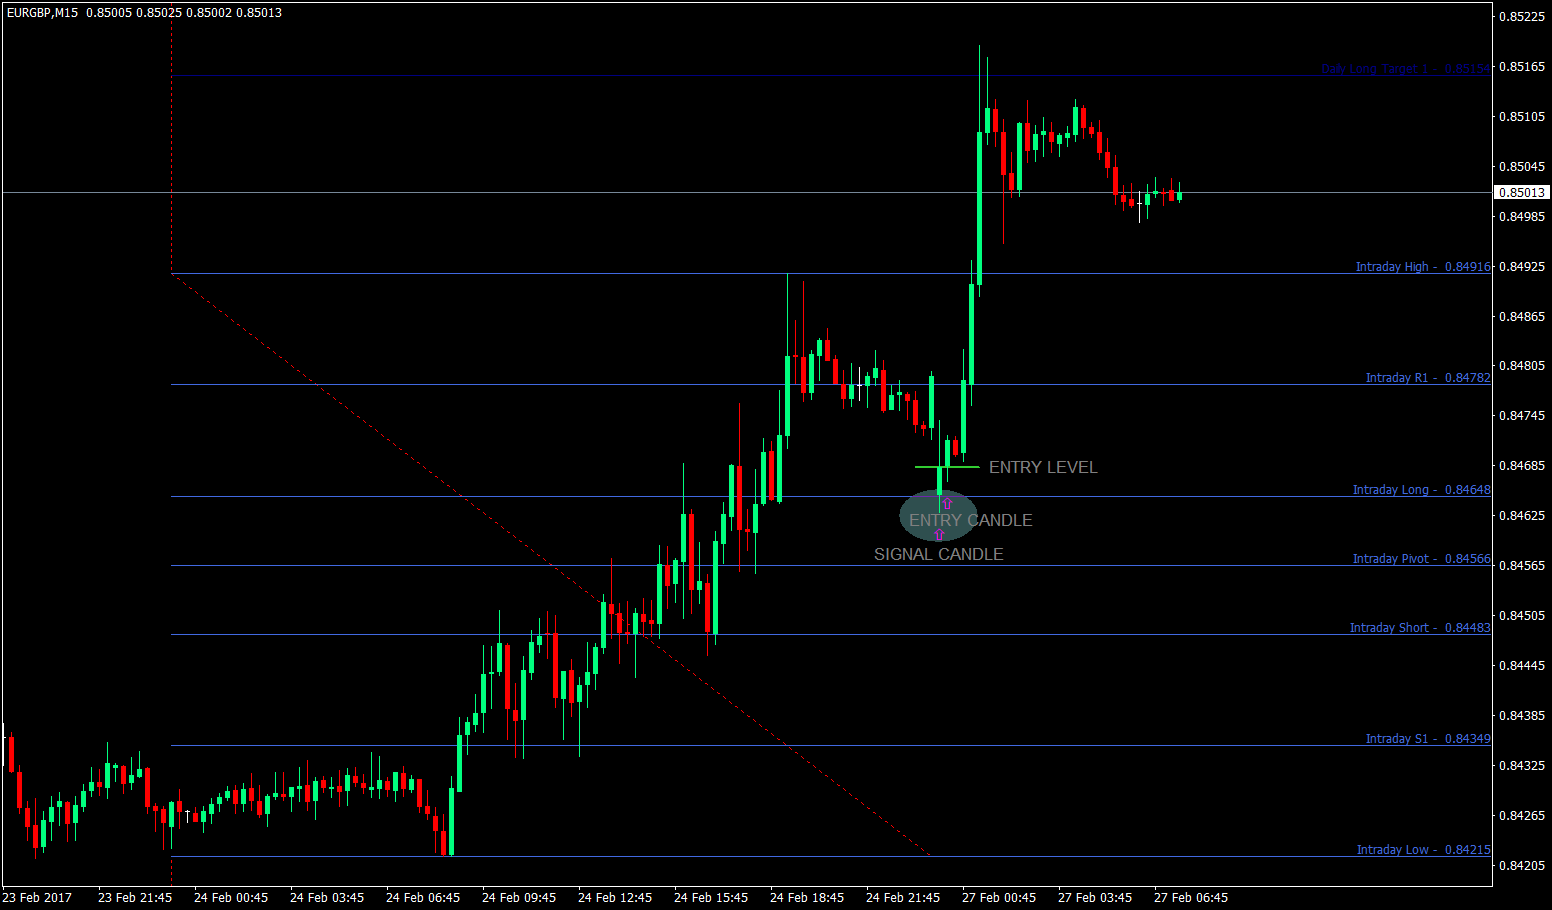
The entry is pretty much straight forward. The indicator will be telling you straight away. We enter long positions when the price challenges, respects and bounces off the Intraday Long support level. On the other hand, we make short positions when the price challenges, respects and bounces off the Intraday Short resistance level. If we don’t see price doing that at those levels, then we skip that pair and move on to the next one. Yes, they could work the other way around, but this is the straight up purpose of these lines, so we better use it the way it was intended to be used. No point reinventing the wheel.
Now, going back to the chart, you would see at a certain point price does challenge, respect and bounce off the Intraday Long support level. That point would be our signal candle. We will enter on the opening of the next candle.
The Stop Loss
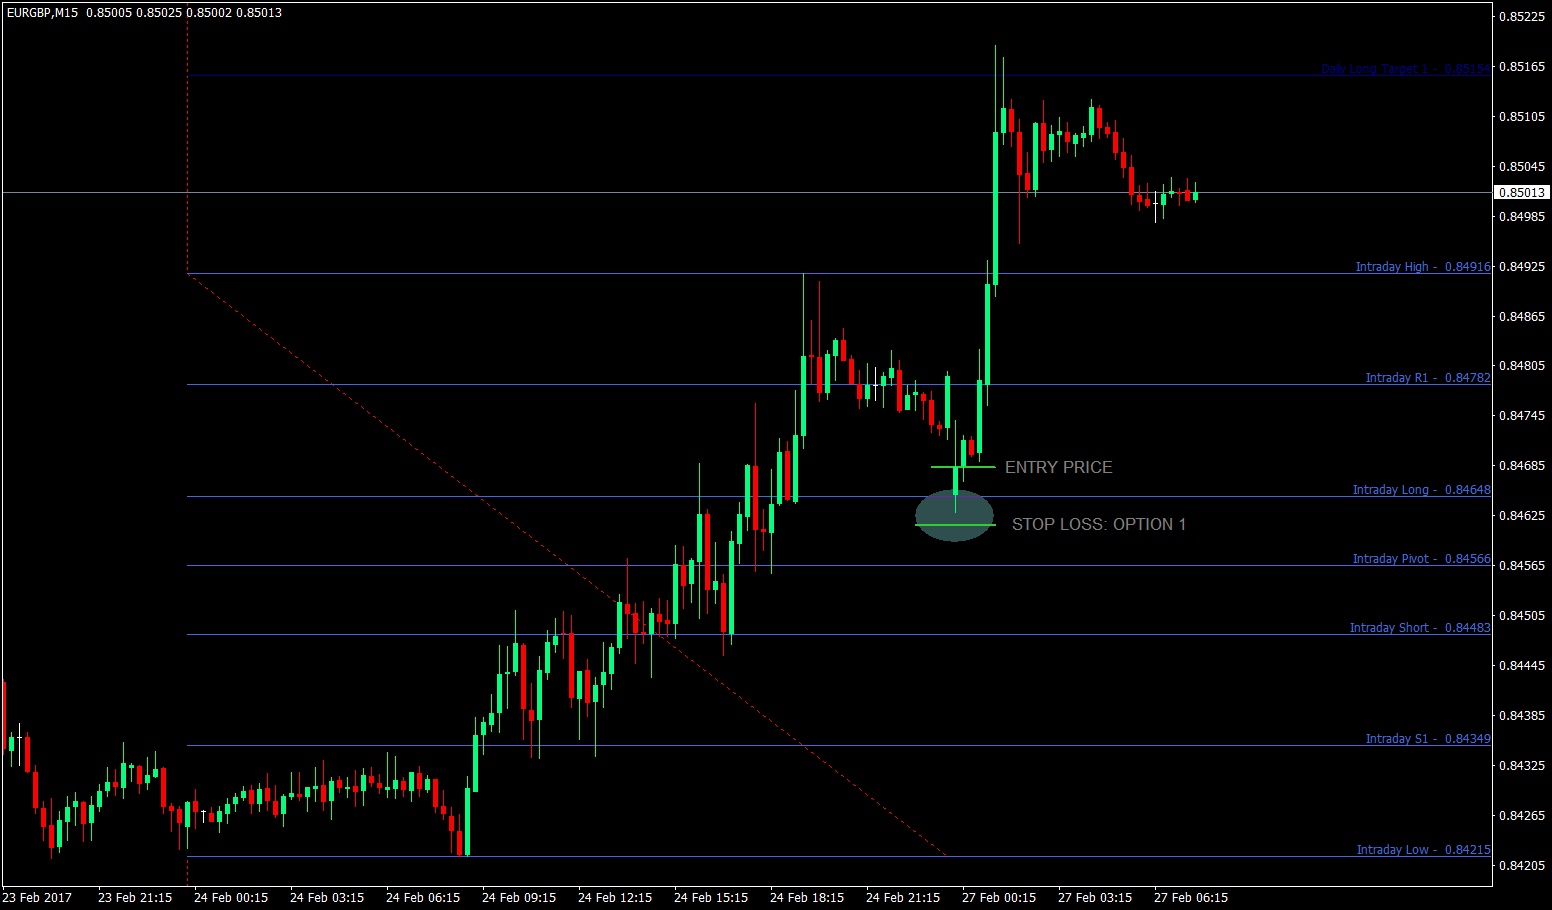
Where should we be putting our Stop Loss? Here, we have two options.
Option 1, we put our Stop Loss right below the signal candle. Why? Because price already respected the Intraday Long line as a support, so we could presume that price wouldn’t be going below that level, and the bottom of the signal candle is below that level. This is somewhat an aggressive type of Stop Loss, as it has a smaller room for the price to breathe. The advantage though is that the Risk Reward Ratio will be higher and thus we could set our volumes higher and earn more per pip.
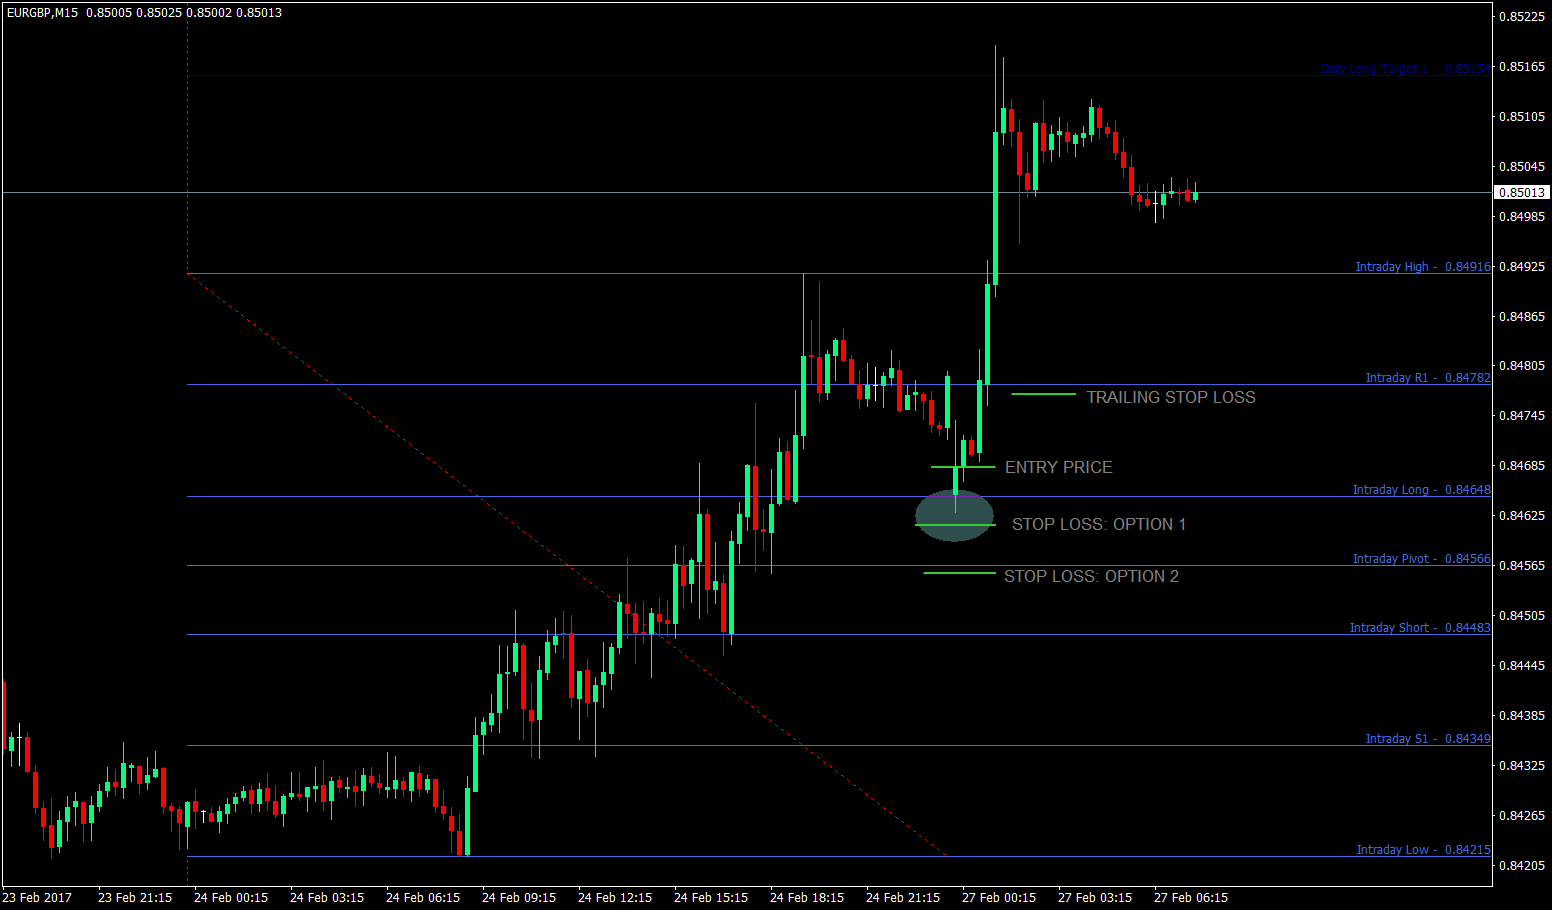
Option 2, on the other hand is more conservative. It hides behind the next support level, the reason being that price shouldn’t be going beyond this level because it has 2 supports in between the price and the stop loss. It is a lot safer as compared to option 1, since it allows for more breathing room for price to move. The drawback however is that the Risk Reward Ratio would be smaller and thus our position size will smaller also, if we would want to adhere to money management rules.

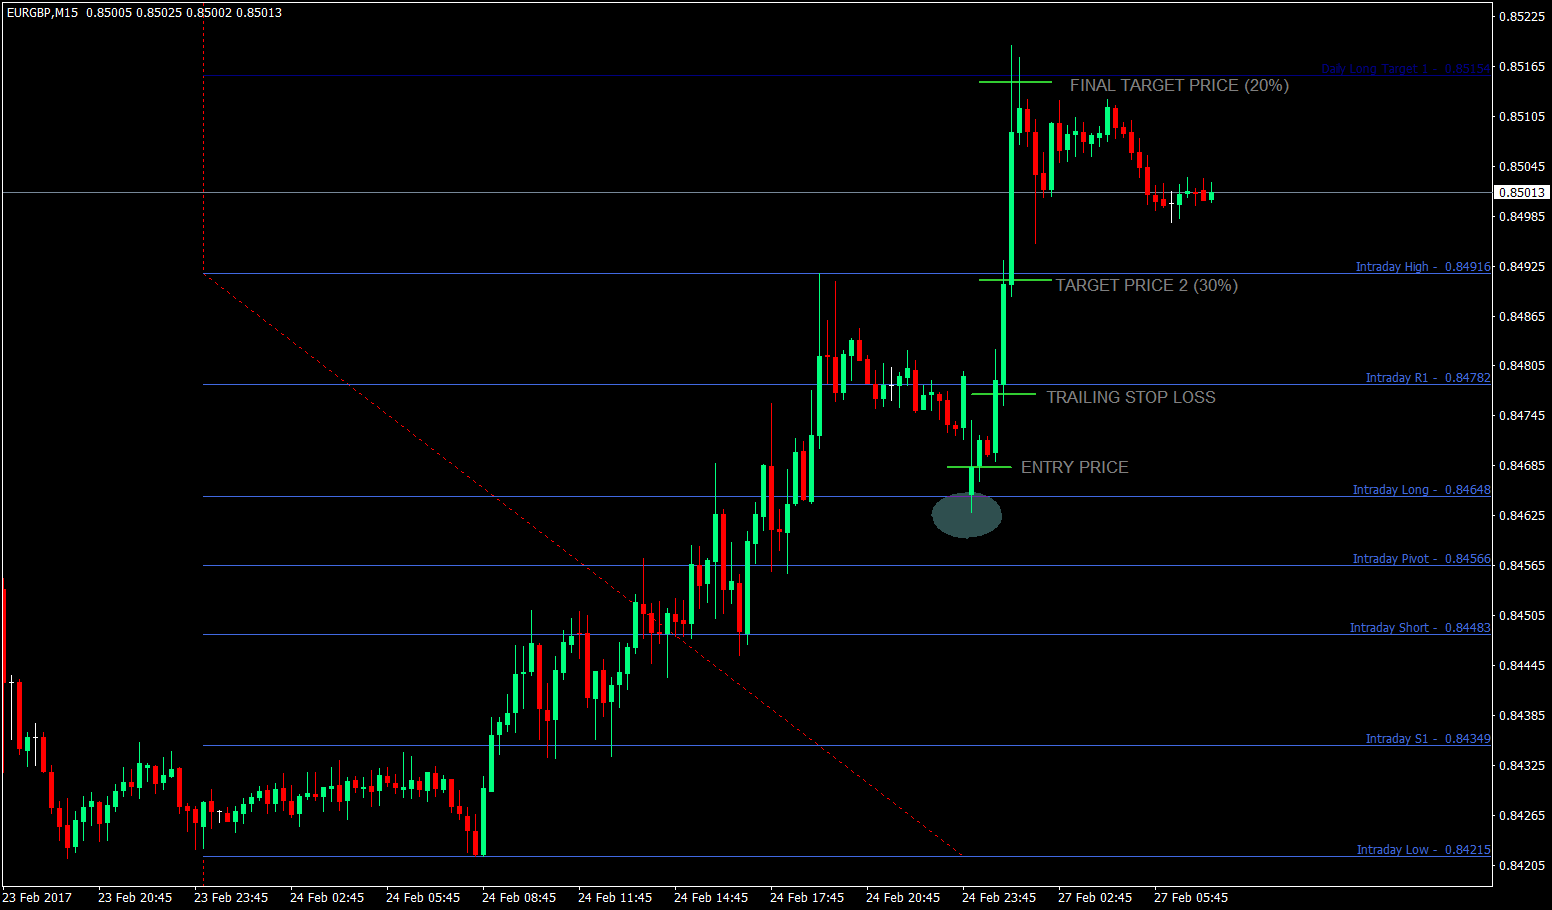
If price does go our way and even more, then we could also do trailing stop losses placing it behind the breached resistance levels which are now new support levels. This protects our profits and ensures that we are on the green towards the end of our trades. We will be doing this as part of managing open trades. Below is an example of where we could be putting our trailing stop loss.
The Take Profit
Now that were done with the Entry and Stop Loss, let’s discuss our Take Profits. This strategy as a standalone strategy has the advantage of allowing for multiple take profits, so we will be taking advantage of this. Given that there are multiple supports and resistances throughout the chart, we could use these supports and resistances as our target prices.
As for the percentages of our position, I would prefer closing 50% of the position on the first Target Price. This would allow me to ensure that even if price would reverse, I will still be at break-even or slightly on profit as long as I have a positive Risk Reward Ratio, since I have already closed half of my position on the first opportunity to take profit. As soon as price reaches Target Price 2, we then close another 30% of the position. Leaving only 20% for the Final Target Price. This is coz reaching the final target price is a tall order and sometimes doesn’t happen. Still, I think it is a worthwhile opportunity to leave 20% open, since it usually allows you to gain a lot of pips if you’d hold on to the trade until the end.
Another thing I’d doing is to trail my Stop Loss as soon as price hits Target Price 2. This would ensure that I would have profits on my last 20% position even if the price reverses.
Conclusion
Fibonacci Ratios on its own is good. Pivot Points on its own is good. Combining it together makes it extraordinary. It allows for precision, which is very important in trading if you’d like to have a high win rate ratio. Also, the best thing about this is that having multiple target prices is inherent with this strategy. And these support and resistance levels also are natural hiding places for Trailing Stop Losses.
This by far, is one of the better stand-alone strategies out there. Practice it, use it, and master it, and you could start making money out of the market.
Recommended MT4 Broker
- Free $50 To Start Trading Instantly! (Withdrawable Profit)
- Deposit Bonus up to $5,000
- Unlimited Loyalty Program
- Award Winning Forex Broker
- Additional Exclusive Bonuses Throughout The Year

>> Claim Your $50 Bonus Here <<
Click here below to download: