Introduction to the PZ Pivot Points Indicator
The Pivot Points Indicator is one of the few technical indicators that is commonly used by professional traders including institutional traders trading for large financial institutions. This is because the Pivot Point levels are key price points where price is more likely to react on. Price could either reverse or breakout of these levels.
What is the PZ Pivot Points Indicator?
The PZ Pivot Points Indicator is a technical analysis tool which automatically plots Pivot Points on the price chart.
This version of the Pivot Points allows users to choose the timeframe on which the Pivot Points are based on, whether it is a daily, weekly, or monthly pivot point.
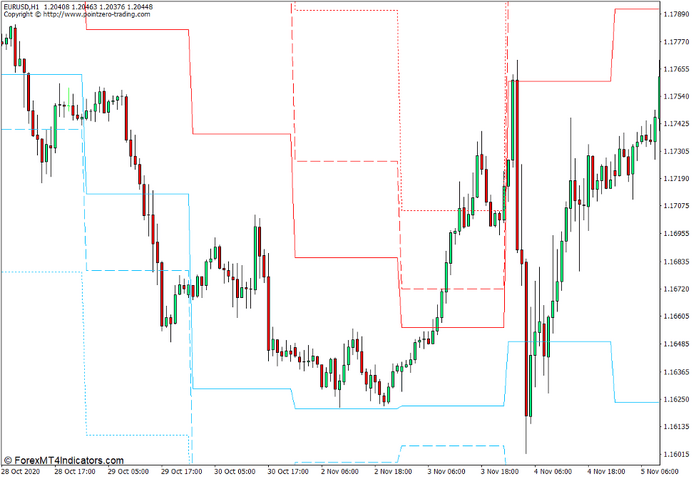
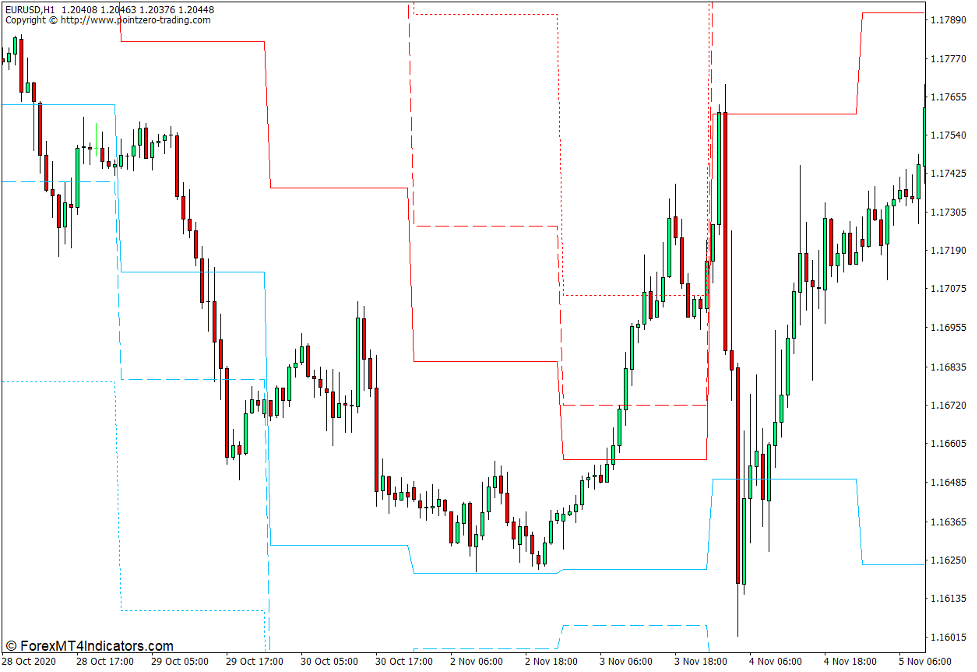
The PZ Pivot Points plots six Pivot Point levels, three of which are Support levels (S1, S2, and S3), and the other three are Resistance levels (R1, R2, and R3).
Below are the corresponding markers for each level.
- S1 – solid sky blue line
- S2 – dashed sky blue line
- S3 – dotted sky blue line
- R1 – solid red line
- R2 – dashed red line
- R3 – dotted red line
How the PZ Pivot Points Indicator Works?
The PZ Pivot Points Indicator has an algorithm which uses the basic Pivot Points calculation method. The main Pivot Point (PP) level is basically the average of the high, low, and close of the prior period on the chosen timeframe. For example, a daily Pivot Point would be the average of the high, low, and close of the prior day. The other support and resistance levels are then derived from the main Pivot Point level.
PP = (High + Low + Close) / 3
R1 = (PP x 2) – Low
R2 = PP + (High – Low)
S1 = (PP x 2) – High
S2 = PP – (High – Low)
The PZ Pivot Points Indicator however does not plot the main Pivot Point level. Instead it only plots the support and resistance levels.
How to use the PZ Pivot Points Indicator for MT4
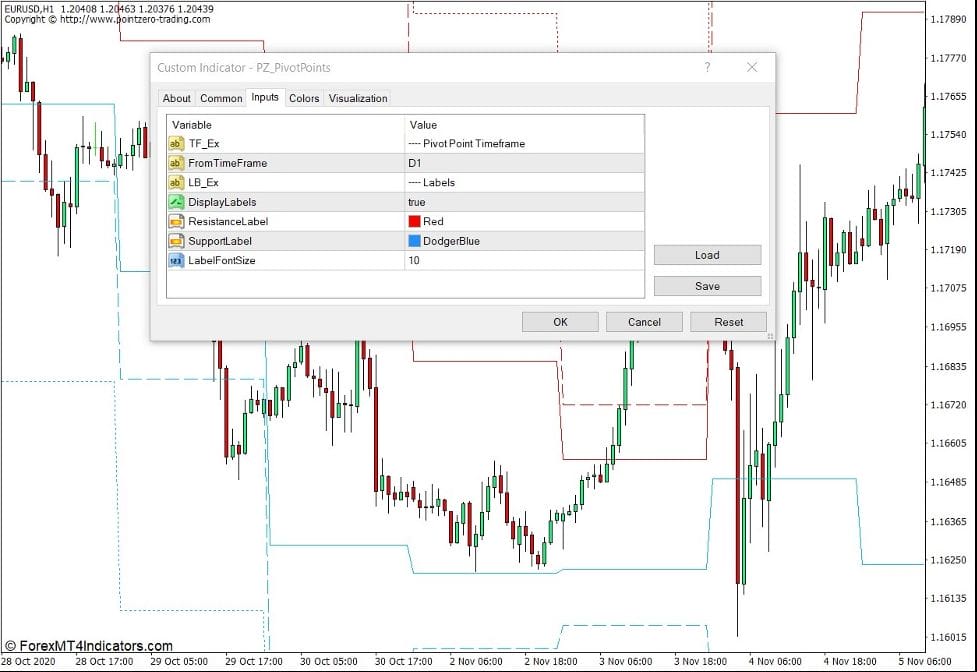
The PZ Pivot Points Indicator has several options within its settings.
“From Time Frame” allows users to choose which timeframe is used as a basis for the Pivot Points.
“Display Labels” toggles the display of the support or resistance level at the far right end of the chart on or off.
“Resistance Label” and “Support Label” allows users to select the color to represent the lines.
“Label Font Size” allows users to modify the font size of the label.
Buy Trade Setup
When to Enter?
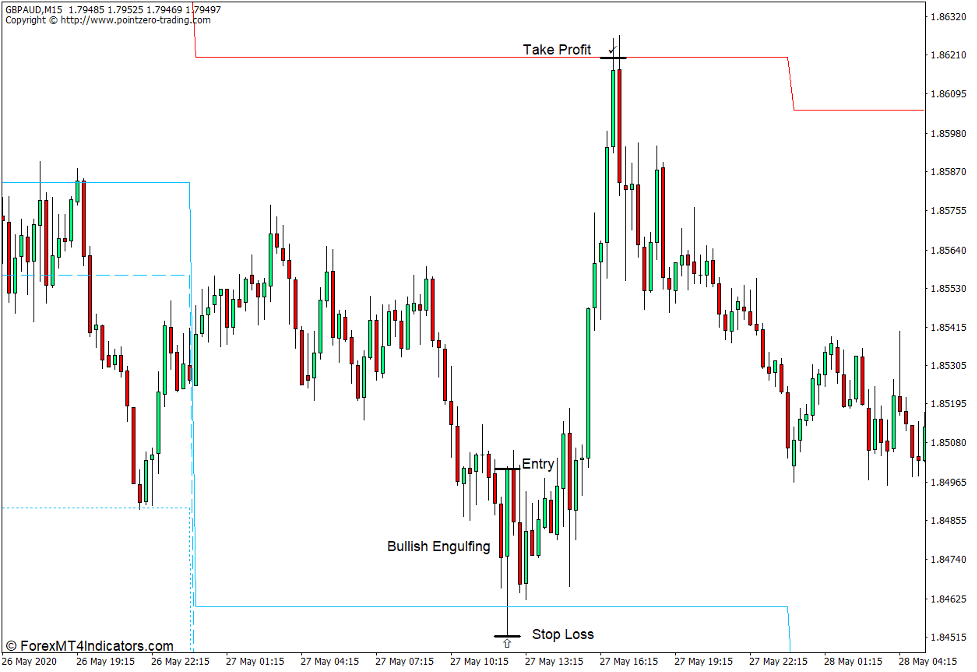
Open a buy order as soon as price action forms a bullish reversal pattern on a support level.
When to Exit?
Set the take profit target on the next resistance level.
Sell Trade Setup
When to Enter?
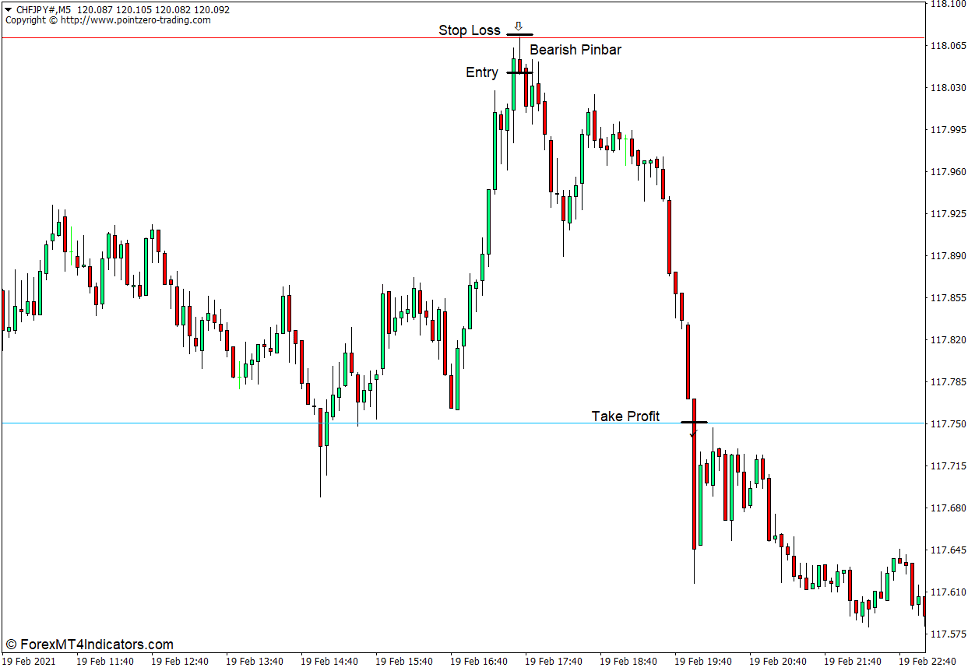
Open a sell order as soon as price action forms a bearish reversal pattern on a resistance level.
When to Exit?
Set the take profit target on the next support level.
Conclusion
The PZ Pivot Points Indicator is a simple Pivot Points indicator which uses the basic calculations. This means that this version of the Pivot Points is very light on the trading platform. It also has the key features necessary for trading Pivot Points, such as historical Pivot Point levels and the selection of the timeframe used as a basis for the levels.
Recommended MT4/MT5 Brokers
XM Broker
- Free $50 To Start Trading Instantly! (Withdraw-able Profit)
- Deposit Bonus up to $5,000
- Unlimited Loyalty Program
- Award Winning Forex Broker
- Additional Exclusive Bonuses Throughout The Year
>> Sign Up for XM Broker Account here <<
FBS Broker
- Trade 100 Bonus: Free $100 to kickstart your trading journey!
- 100% Deposit Bonus: Double your deposit up to $10,000 and trade with enhanced capital.
- Leverage up to 1:3000: Maximizing potential profits with one of the highest leverage options available.
- ‘Best Customer Service Broker Asia’ Award: Recognized excellence in customer support and service.
- Seasonal Promotions: Enjoy a variety of exclusive bonuses and promotional offers all year round.
>> Sign Up for FBS Broker Account here <<
(Free MT4 Indicators Download)
Click here below to download:


