


Pedagang teknikal telah cuba untuk menggabungkan statistik dengan perdagangan. Lagipun, kelebihan dagangan berdasarkan analisis teknikal bergantung pada kebarangkalian. Walau bagaimanapun, banyak percubaan untuk melakukannya sering terbukti sia-sia. Satu konsep daripada statistik yang menunjukkan beberapa janji dan sebenarnya telah digunakan oleh ramai pedagang ialah Regresi Linear. Strategi ini menunjukkan kepada kita contoh penunjuk yang menggunakan regresi linear untuk membantu pedagang memahami carta harga.
i-Penunjuk Regresi
Penunjuk i-Regression ialah penunjuk teknikal tersuai yang berdasarkan konsep statistik yang dipanggil Regresi Linear. Penggunaan regresi linear sedemikian membolehkan pedagang mengenal pasti saluran harga dengan lebih mudah.
Penunjuk ini dibangunkan untuk mengenal pasti saluran harga secara automatik menggunakan regresi linear sebagai asas untuk memplot julat saluran. Ia melakukan ini dengan menggunakan konsep Keluk Loceng. Ia kemudiannya mengenal pasti harga min berdasarkan pengagihan harga. Langkah seterusnya yang dilakukan oleh algoritmanya ialah menggunakan sisihan piawai untuk mengira had luar julat supaya peratusan tertentu mata harga jatuh dalam julat. Sebagai contoh, sisihan piawai dua menganggarkan bahawa kira-kira 95% daripada titik data harga berada dalam julat saluran.
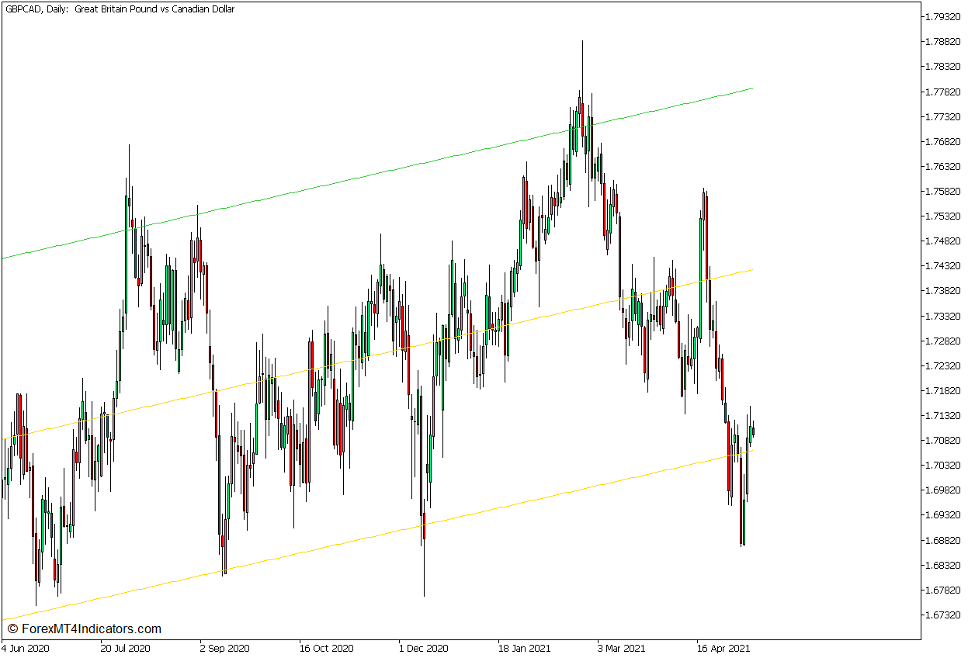
Penunjuk i-Regression mempunyai tiga tetapan yang mengubah cara penunjuk memplot saluran. Jenis saluran pertama yang diplotnya ialah saluran regresi linear asas. Ia memplot tiga garis lurus. Garis tengah mewakili harga min atau median julat. Garis atas dan bawah mewakili ekstrem atas dan bawah julat harga yang membolehkan penunjuk meliputi kira-kira 95% daripada titik harga dalam saluran harga.
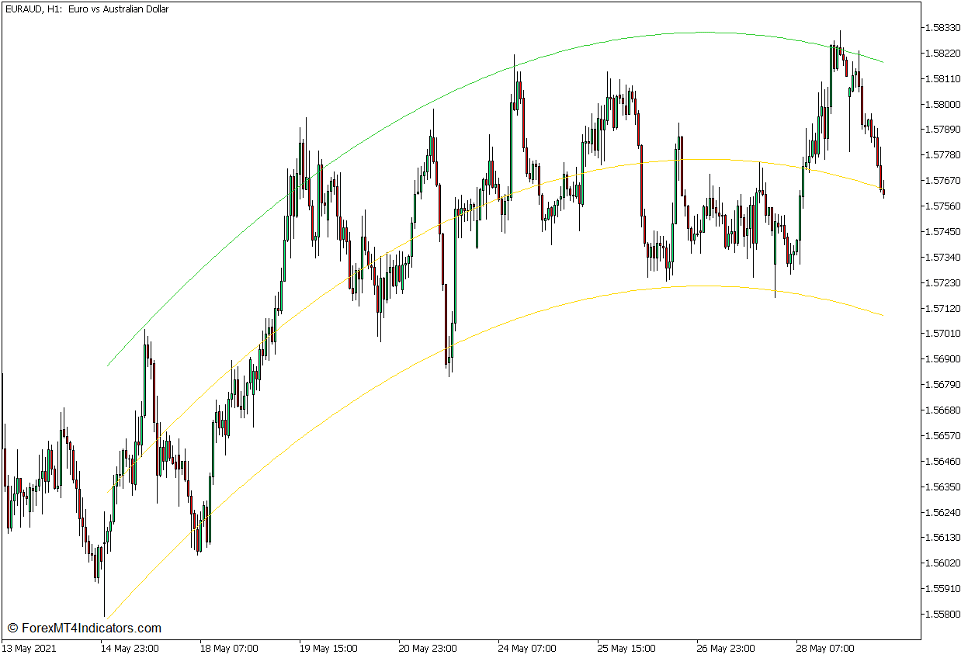
Jenis saluran seterusnya yang diplotnya ialah jenis saluran parabola. Ia menggunakan formula yang menyebabkan penunjuk memplot saluran yang akan bengkok sekali. Ini membolehkan pengguna mengenal pasti dengan mudah perubahan trajektori tindakan harga.
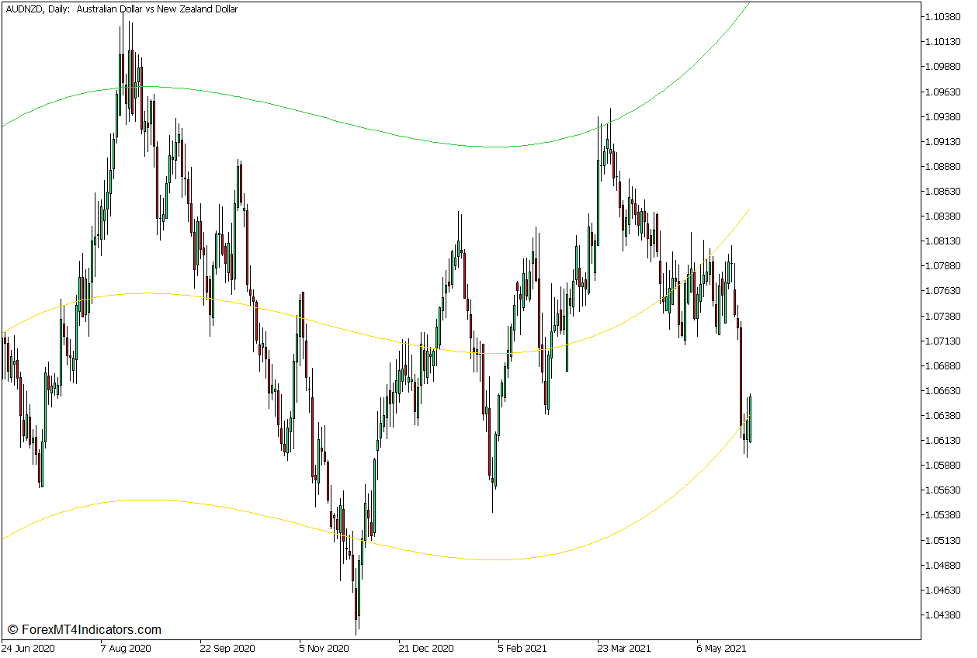
Jenis saluran terakhir yang ditunjukkan oleh penunjuk ini ialah saluran yang menggunakan formula padu. Ini membolehkan penunjuk untuk merancang saluran yang akan membengkok pada dua titik. Ini membolehkan pengenalpastian yang lebih tepat bagi trajektori tindakan harga.
Lilin Bar Pin dan Penolakan Harga
Corak candlestick mungkin merupakan salah satu isyarat paling mentah dan paling segera yang boleh digunakan oleh pedagang. Ini kerana corak candlestick menceritakan kisah yang akan menunjukkan arah yang mungkin diambil oleh pasaran. Corak candlestick pembalikan khususnya adalah tanda-tanda penolakan harga dan kemungkinan pembalikan momentum.
Corak Pin Bar mungkin merupakan salah satu corak candlestick pembalikan momentum yang paling asas lagi berkesan yang mungkin digunakan oleh pedagang. Ia adalah corak candlestick ringkas yang terdiri daripada hanya satu candle. Ia dikenal pasti sebagai lilin dengan badan kecil yang boleh dibezakan dengan sumbu panjang di satu hujung dan sumbu kecil di hujung bertentangan. Arahnya boleh dikenal pasti berdasarkan di mana sumbu panjang berada dalam hubungan dengan badannya. Jika sumbu panjang berada di bawah badannya, lilin itu akan dikenal pasti sebagai lilin bar pin menaik. Sebaliknya, jika sumbu panjang berada di atas badannya, maka lilin itu menunjukkan kemungkinan pembalikan menurun.
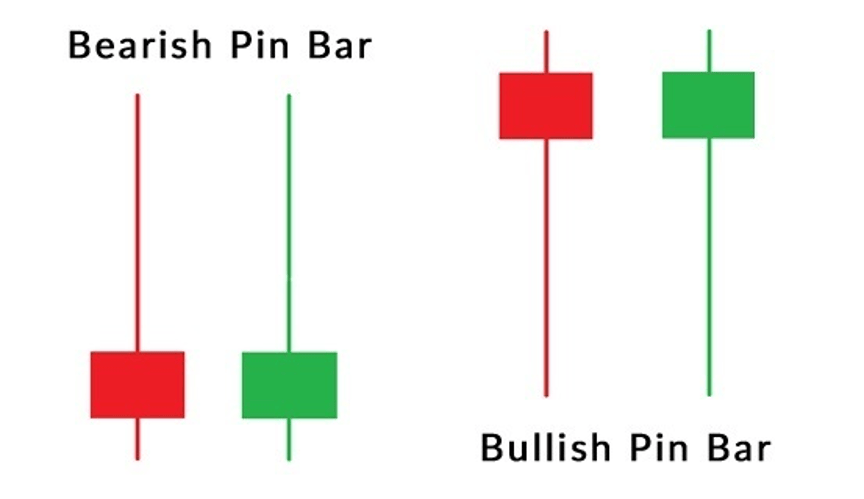
Corak Pin Bar ialah petanda kemungkinan pembalikan momentum kerana ia memberitahu kita kisah penolakan harga. Ia memberitahu kita bahawa pasaran tidak selesa dengan tahap harga tertentu dan oleh itu pasaran akan segera menolaknya, itulah sebabnya pasaran akan pulih dengan cepat berbanding tinggi atau rendah dan ditutup berhampiran hujung bertentangan, menghasilkan lilin dengan sumbu panjang dan badan kecil.
Konsep Strategi Dagangan
i-Regression Parabolic Median Break Strategi Dagangan Forex untuk MT5 ialah strategi dagangan berasaskan saluran mudah yang menyediakan isyarat dagangan apabila harga melintasi purata saluran. Ia menggunakan Penunjuk i-Regression untuk membantu peniaga mengenal pasti saluran harga secara objektif. Khususnya, kami akan menggunakan jenis saluran parabola. Ini membolehkan kami memerhatikan arah tindakan harga, serta trajektori arah aliran.
Kriteria pertama yang harus dipenuhi ialah persilangan yang kuat antara harga dan garis tengah saluran i-Regression parabola. Ini menunjukkan peralihan arah momentum. Walau bagaimanapun, kami tidak akan berdagang semata-mata berdasarkan persilangan antara harga dan median saluran. Kami akan membenarkan harga menarik semula ke arah garis tengah. Kami kemudian akan memerhatikan tanda-tanda penolakan harga di kawasan sekitar garisan tengah. Ini akan dikenal pasti oleh lilin bar pin yang menolak garis tengah saluran.
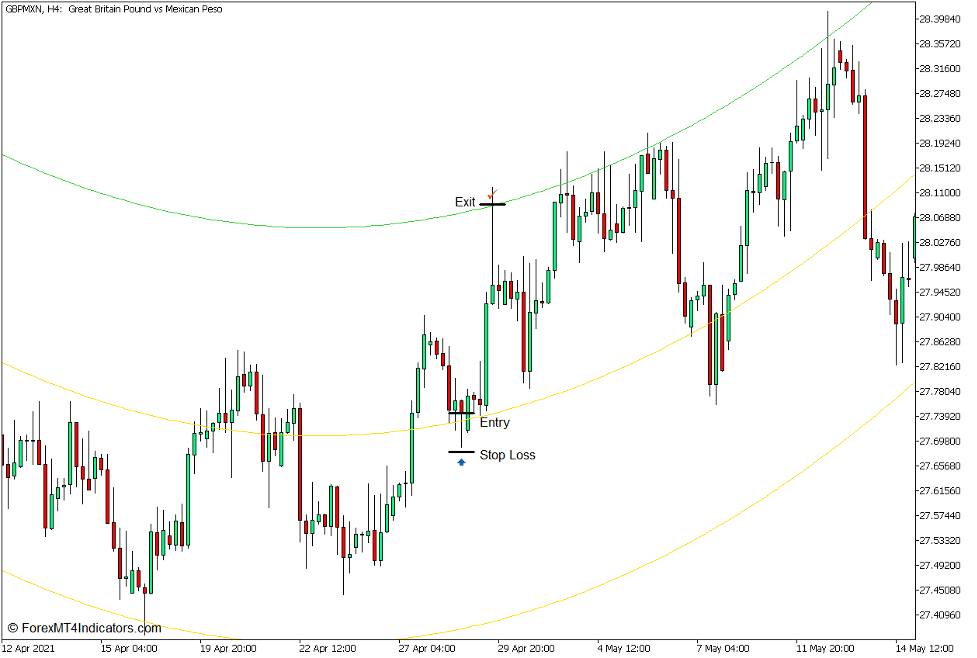
Beli Persediaan Perdagangan
Kemasukan
- Harga harus melintasi di atas garis tengah saluran i-Regression dengan momentum yang kuat.
- Benarkan harga menarik balik ke arah garis tengah saluran.
- Buka pesanan beli sebaik sahaja lilin bar pin menaik dikenal pasti yang menunjukkan penolakan harga kawasan tersebut.
Stop Loss
- Tetapkan stop loss di bawah lilin masuk.
Keluar
- Tutup dagangan sebaik sahaja harga menyentuh garisan atas saluran i-Regression.
Jual Persediaan Perdagangan
Kemasukan
- Harga harus melintasi di bawah garis tengah saluran i-Regression dengan momentum yang kuat.
- Benarkan harga menarik balik ke arah garis tengah saluran.
- Buka pesanan jual sebaik sahaja lilin bar pin menurun dikenal pasti yang menunjukkan penolakan harga kawasan tersebut.
Stop Loss
- Tetapkan stop loss di atas lilin masuk.
Keluar
- Tutup dagangan sebaik sahaja harga menyentuh garis bawah saluran i-Regression.

Kesimpulan
Dagangan berasaskan saluran adalah salah satu strategi dagangan paling asas yang mungkin digunakan oleh pedagang. Kebanyakan peniaga akan melakukan ini dengan merancang garis arah aliran berdasarkan tindakan harga. Walau bagaimanapun, kaedah ini mungkin subjektif. Sebaliknya, strategi yang dinyatakan di atas membolehkan pedagang mengenal pasti saluran secara objektif menggunakan Penunjuk i-Regression.
Satu variasi strategi ini adalah untuk berdagang pada penolakan harga yang terbentuk sama ada pada baris atas atau bawah saluran. Ini mungkin membolehkan hasil yang lebih tinggi berdasarkan ganjaran risiko.
Pedagang yang akan menggunakan strategi ini harus belajar membaca tindakan harga kerana ia adalah asas asas isyarat perdagangan.
Broker MT5 yang disyorkan
Broker XM
- Percuma $ 50 Untuk Mula Berdagang Dengan Segera! (Keuntungan yang boleh dikeluarkan)
- Bonus Deposit sehingga $5,000
- Program Kesetiaan Tanpa Had
- Broker Forex Pemenang Anugerah
- Bonus Eksklusif Tambahan Sepanjang tahun

>> Daftar untuk Akaun Broker XM di sini <
Broker FBS
- Berdagang 100 Bonus: Percuma $100 untuk memulakan perjalanan dagangan anda!
- 100% Bonus Deposit: Gandakan deposit anda sehingga $10,000 dan berdagang dengan modal yang dipertingkatkan.
- Leverage hingga 1: 3000: Memaksimumkan potensi keuntungan dengan salah satu pilihan leveraj tertinggi yang ada.
- Anugerah 'Broker Perkhidmatan Pelanggan Terbaik Asia': Kecemerlangan yang diiktiraf dalam sokongan dan perkhidmatan pelanggan.
- Promosi bermusim: Nikmati pelbagai bonus eksklusif dan tawaran promosi sepanjang tahun.

>> Daftar untuk Akaun Broker FBS di sini <
Klik di sini di bawah untuk memuat turun: