


Strategi Dagangan Saluran Forex
Carta harga selalunya kelihatan seperti keadaan huru-hara. Kod yang mengambil masa selama-lamanya untuk ditafsir. Dan ini selalunya benar, terutamanya untuk pedagang baru dengan mata yang tidak terlatih. Walau bagaimanapun, bagi pedagang yang mempunyai masa carta yang mencukupi, carta forex kadangkala mendedahkan corak yang teratur di tengah-tengah huru-hara.
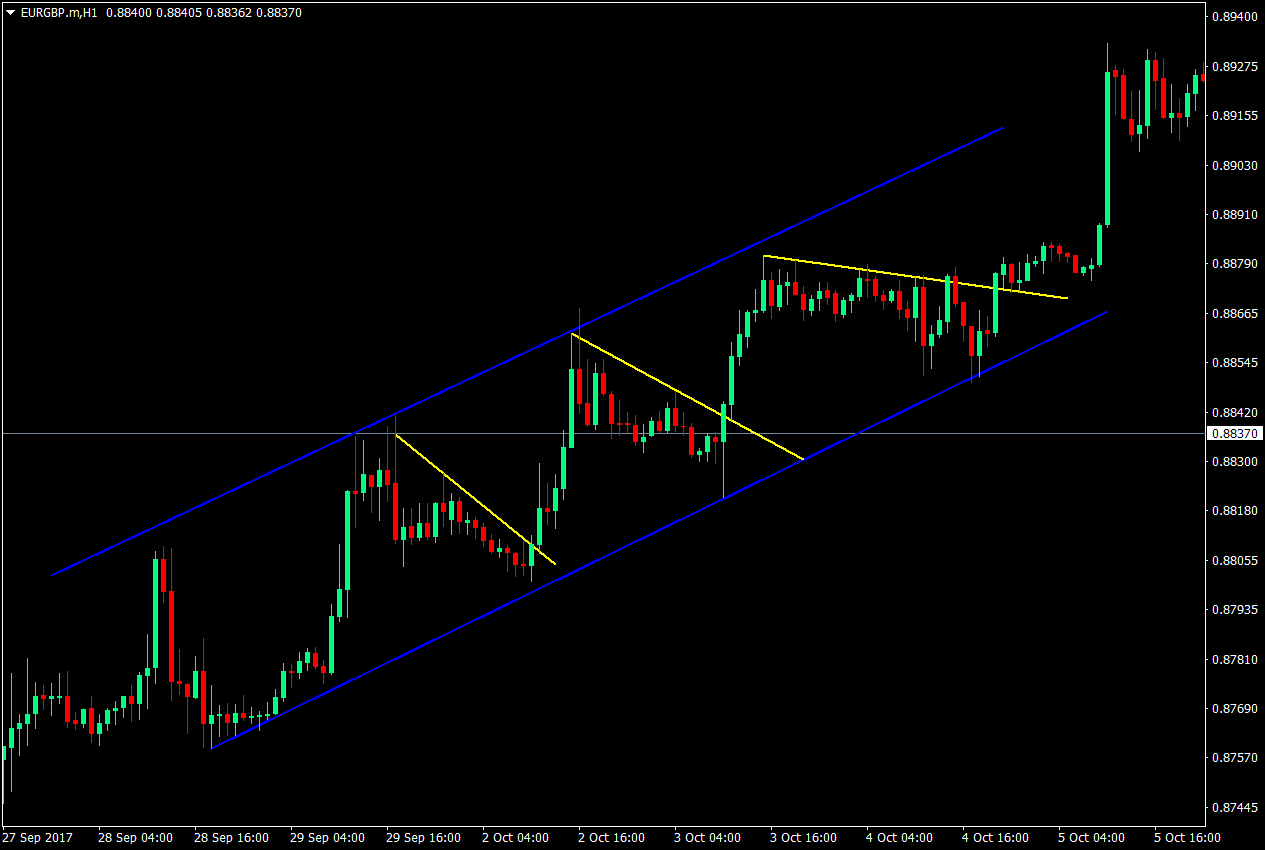
Ambil contoh carta ini.
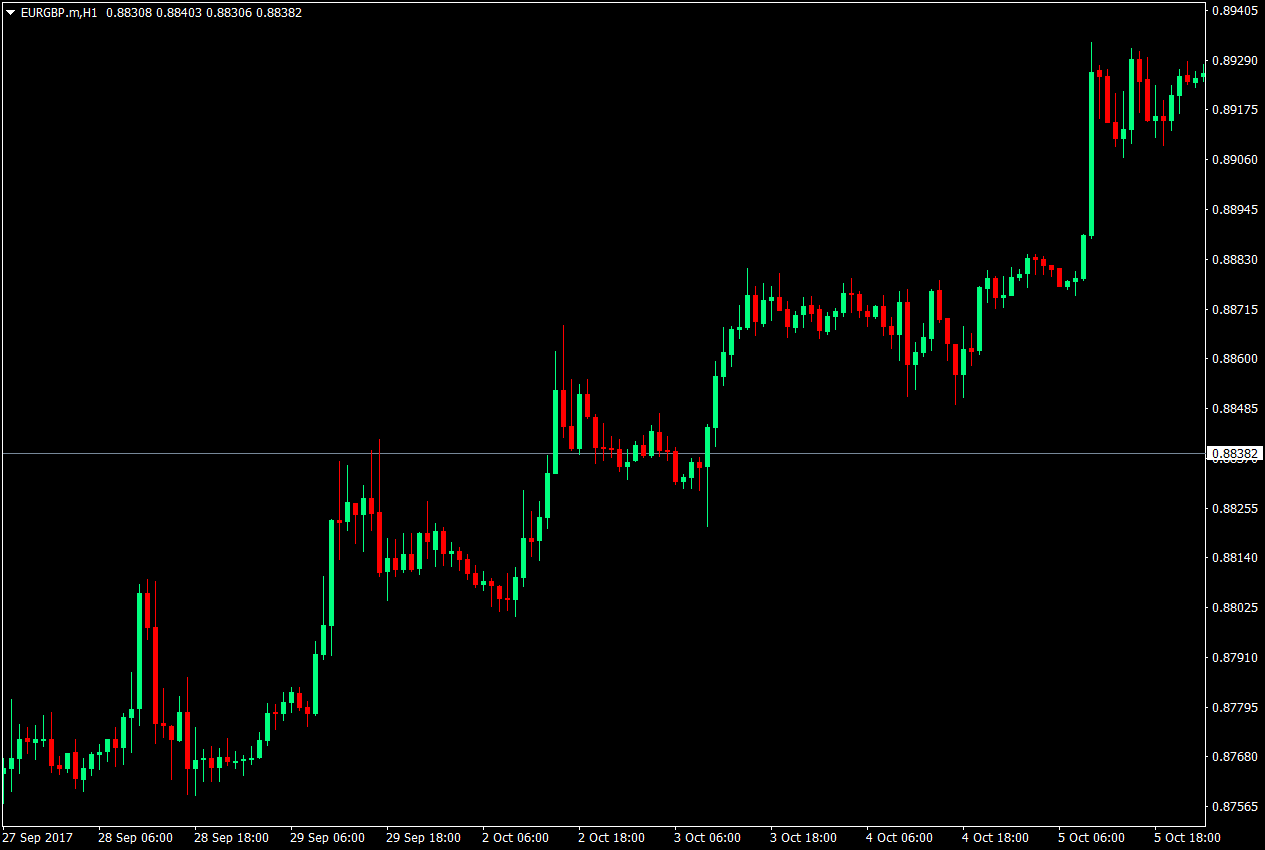
Pemula, sering melihat carta ini dan tidak tahu apa yang perlu dilakukan dengannya. Sesetengah akan mempunyai idea bahawa ini ialah carta arah aliran menaik, tetapi masih tidak mempunyai petunjuk tentang cara untuk berdagang. Tetapi segelintir yang telah memerhatikan carta untuk beberapa lama akan melihat sokongan dan rintangan utama membentuk saluran.
Selain itu, mereka akan melihat rintangan di mana harga meletus untuk meneruskan aliran menaik.
Bagi mereka, carta telah menjadi pasaran yang teratur dan boleh diramal, yang meningkatkan keyakinan mereka dalam berdagang persediaan mereka, dan meningkatkan peluang mereka untuk mempunyai perdagangan yang menguntungkan.
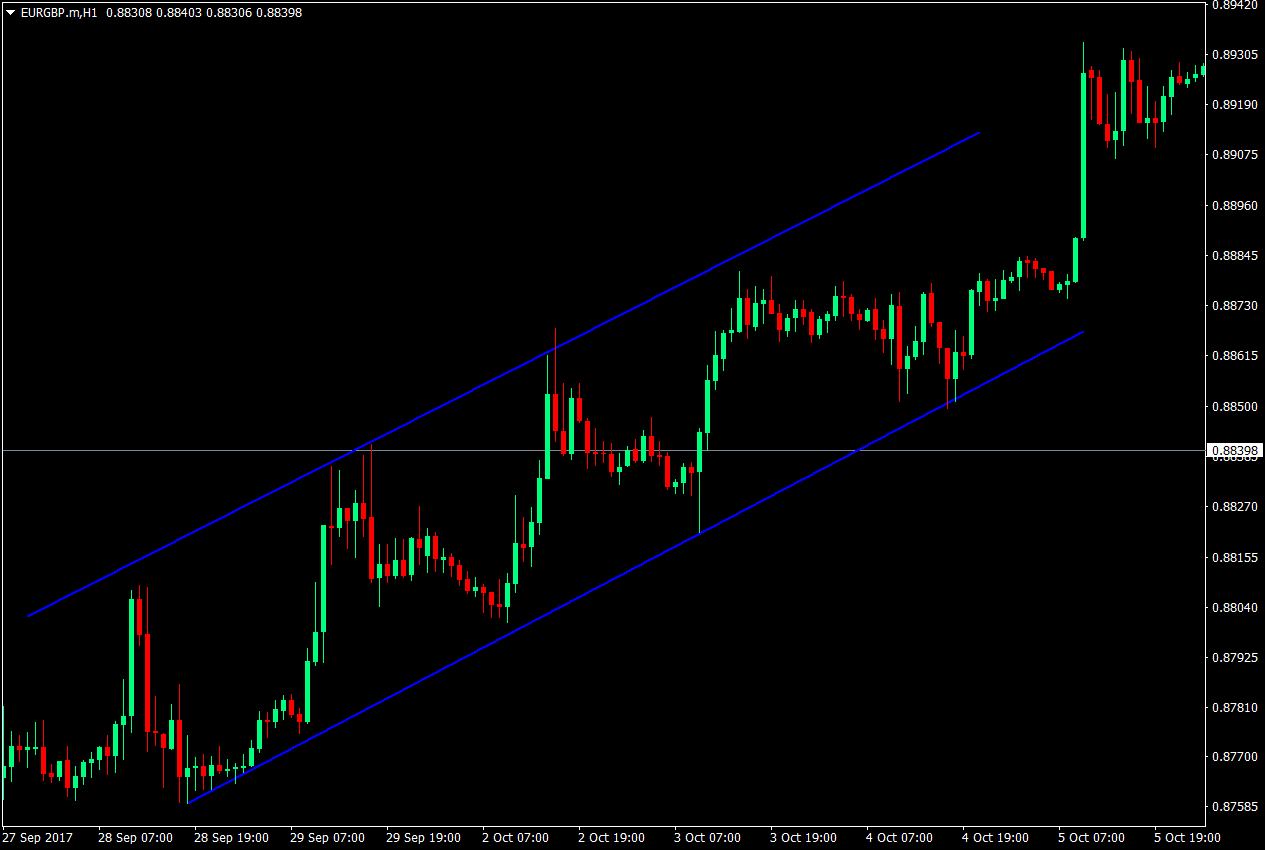
Saluran dagangan tidaklah sesulit yang didengari. Semuanya bermula dengan mengenal pasti sokongan dan rintangan utama. Walau bagaimanapun, bukannya sokongan dan rintangan mendatar, apa yang biasa berlaku ialah sokongan dan rintangan pepenjuru. Untuk melayakkan diri sebagai sokongan atau rintangan, harga mesti menghormati sokongan atau rintangan yang dikenal pasti dua kali, dan disahkan oleh ayunan tinggi ketiga atau rendah.
Sokongan dan rintangan yang terhasil hendaklah selari antara satu sama lain untuk dianggap sebagai saluran, dengan rintangan sebagai sempadan atas saluran dan sokongan sebagai sempadan bawah saluran.
Setelah saluran dikenal pasti, adalah mudah untuk melihat bagaimana harga melantun naik dan turun carta harga bergerak dari sokongan ke rintangan, kemudian kembali ke sokongan, berulang kali. Ini menjadi carta yang teratur, yang lebih mudah untuk diramalkan.
Cara Berdagang Saluran dengan Berkesan
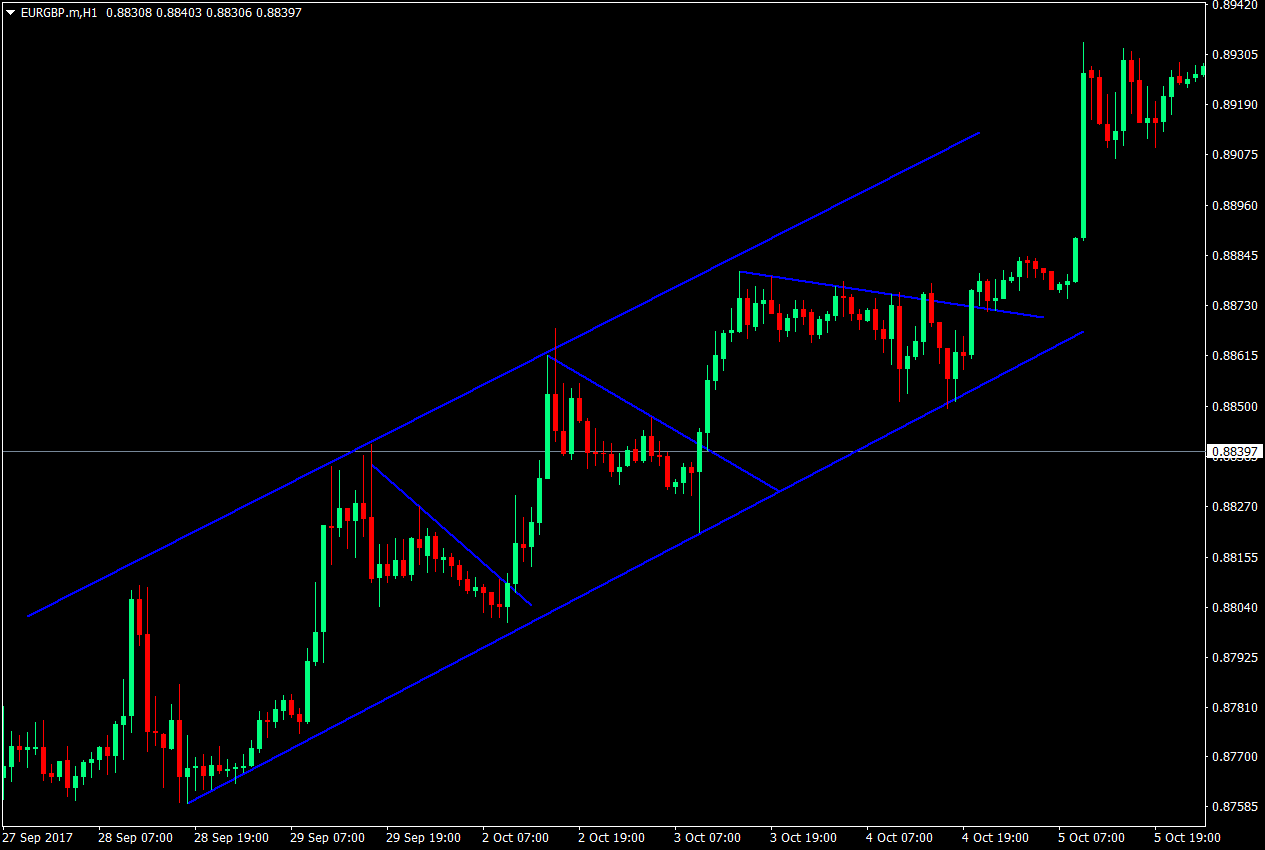
Dalam saluran, harga akan mempunyai sokongan pepenjuru kecil dan rintangan, selalunya membentuk corak kecil atau bahkan saluran kecil, yang menjadi lebih jelas pada rangka masa yang lebih rendah.
Corak adalah baik dan baik, ia boleh berfungsi sebagai pertemuan tambahan atau rasional untuk mengambil perdagangan. Walau bagaimanapun, penggunaannya berakhir di sana, penggalak keyakinan tambahan untuk persediaan dagangan. Apa yang penting ialah sokongan atau rintangan di mana dagangan harus keluar.
Untuk mengenal pasti arah mana perdagangan harus diambil, kita harus terlebih dahulu mengenal pasti sama ada saluran adalah menaik atau menurun. Dalam kes ini, carta ialah saluran aliran menaik. Memandangkan, ini ialah saluran aliran menaik, apa yang kita akan cari ialah melantun daripada sokongan saluran dan penembusan daripada rintangan kecil. Oleh itu, kami boleh melepaskan tanda-tanda lain pada carta dan mempertimbangkan hanya saluran, dan rintangan kecil untuk persediaan dagangan.
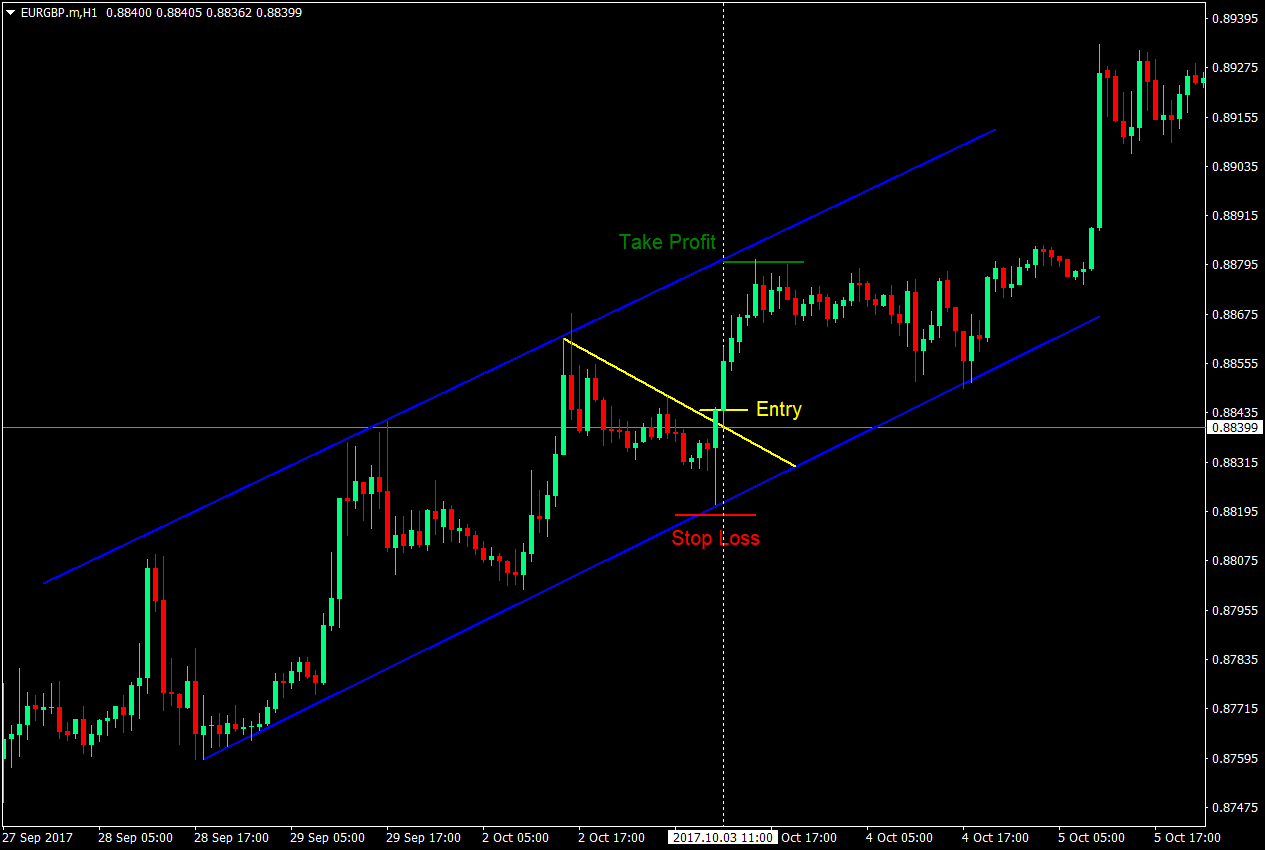
Persediaan Perdagangan: Kemasukan, Hentikan Kerugian dan Ambil Untung
Memandangkan ini adalah aliran menaik, perkara yang akan kami analisis ialah persediaan beli.
Kemasukan: Untuk memasuki perdagangan, penembusan dari rintangan kecil harus berlaku. Ujian semula juga akan menjadi pengesahan perdagangan yang berguna kerana ini meningkatkan kebarangkalian pelarian sebenar. Entri boleh sama ada pesanan henti beli di atas paras tertinggi lilin pelarian, atau pesanan belian pasaran pada ujian semula.
Stop Loss: Stop loss harus diletakkan pada ayunan rendah kecil, yang selalunya di bawah sokongan saluran.
Take Profit: Ambil untung hendaklah ditetapkan pada hujung atas saluran yang sepadan berserenjang dengan lilin masuk. Ini kerana sukar untuk meramalkan di mana harga akan berhenti kerana kami menggunakan rintangan pepenjuru sebagai asas untuk sasaran kami. Juga, ada kalanya harga hanya berada berhampiran rintangan saluran, tetapi tidak akan menyentuhnya.
Kesimpulan
Saluran dagangan ialah kemahiran asas yang digunakan oleh ramai pedagang profesional. Ini mungkin disebabkan oleh cara persediaan menjadi teratur, walaupun pasaran huru-hara, yang meningkatkan keyakinan dalam persediaan dagangan.
Pertemuan saluran kenaikkan, penembusan daripada sokongan kecil, dan selalunya corak carta kesinambungan kenaikkan, meningkatkan kebarangkalian perdagangan yang berjaya. Penunjuk lain juga boleh menyokong sebagai pertemuan untuk persediaan perdagangan saluran.
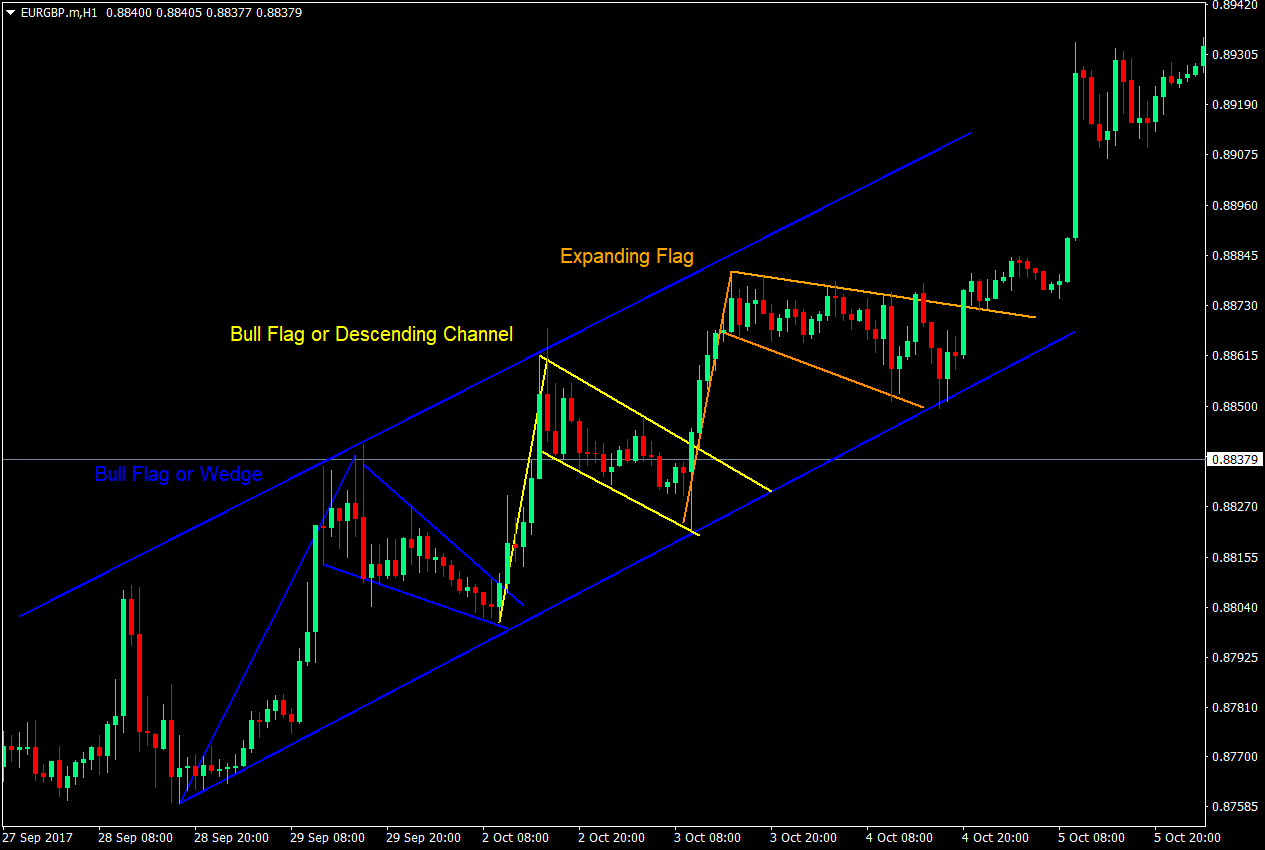
Walau bagaimanapun, ada kalanya persediaan perdagangan terbentuk daripada penguncupan, bukannya anjakan. Bendera dan segi empat yang mengembang sering dijumpai semasa pengecutan, manakala bendera lembu jantan, panji dan baji sering ditemui pada penguncupan. Saya lebih suka berdagang anjakan kerana ia lebih mudah untuk diramalkan dan kerana pelarian lebih jelas.
Perdagangan saluran tidak sempurna. Masih terdapat beberapa perdagangan yang gagal apabila menggunakan perdagangan saluran. Walau bagaimanapun, apabila digabungkan dengan strategi dan pertemuan lain, persediaan menjadi persediaan kebarangkalian tinggi.