Introduction to the Market Structure High Low Indicator
Horizontal support and resistance levels are key points where market flow traders often make trading decisions, either trading breakouts or reversals. The Market Structure High Low Indicator is a technical tool which traders can use for this purpose.
What is the Market Structure High Low Indicator?
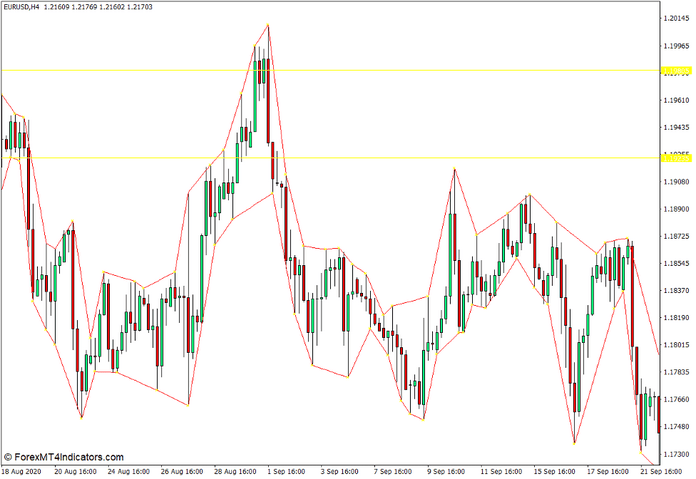
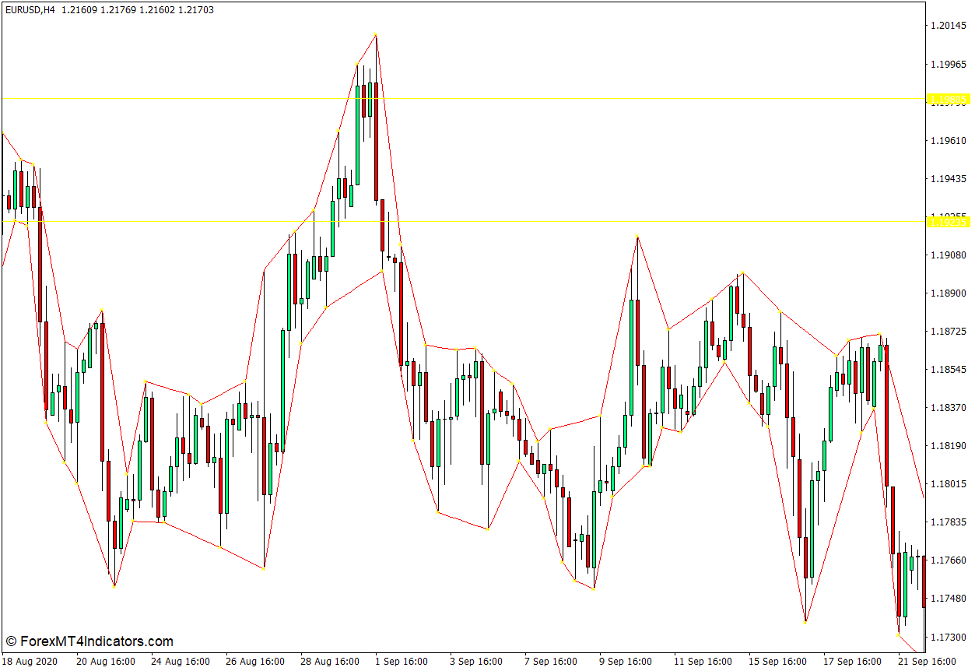
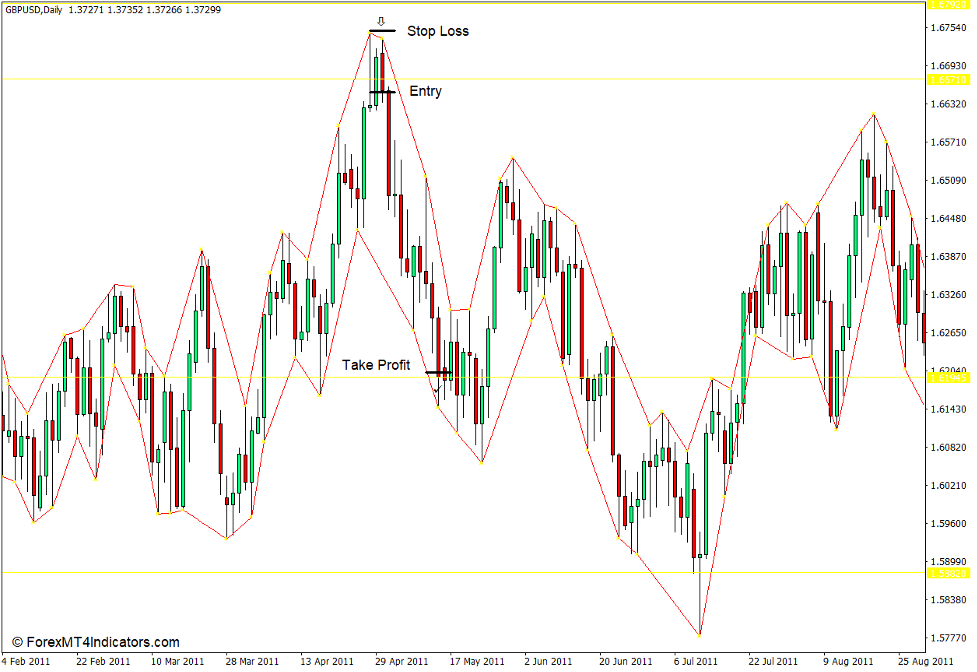
The Market Structure High Low Indicator is an indicator which plots a channel around price action. It also plots horizontal supports and resistances based on swing highs and swing lows. This indicator also marks the identified swing highs and swing lows with a yellow dot.
How the Market Structure High Low Indicator Works?
The Market Structure High Low Indicator first identifies the minor swing highs and swing lows based on major fractal points. These are patterns wherein the middle candle either has the highest high or lowest low among a series of candles. The indicator then marks the swing highs and swing lows with a yellow dot. It then connects the swing highs with the next swing high and the swing lows with the next swing lows forming a channel like structure wrapping around price action.
As for the horizontal lines, the indicator identifies swing highs and swing lows which are closely in range with other swing highs and swing lows. This range is preset at 5 pips. It then plots a horizontal line on points which fit the profile. Darker colored lines indicate that more points are connected by the line.
How to use the Market Structure High Low Indicator for MT4
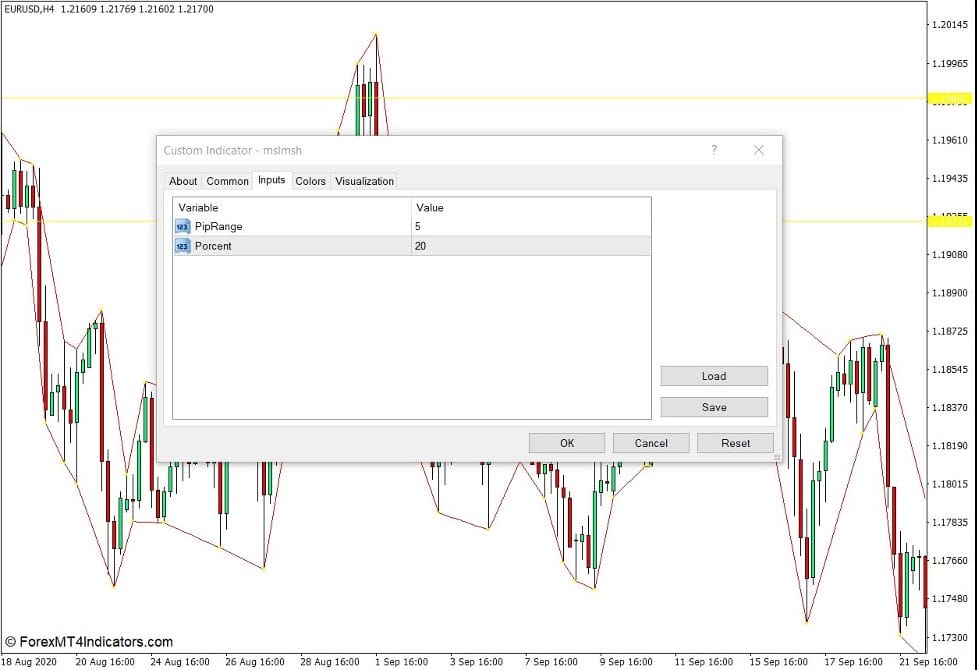
The Market Structure High Low Indicator has a couple of variables which modifies the sensitivity of the indicator. It is important that these variables are modified since the indicator might be aggressively too sensitive as a preset.
“PipRange” refers to the number of pips used by the indicator to qualify the points that would connect the horizontal lines. The lower the input variable, the fewer the horizontal lines.
“Porcent” refers to the percentage of the deviation between points which the indicator could allow. The higher the input variable, the fewer the horizontal lines.
Traders can use the channel like structure marking the range of price action as a basis for identifying trend direction. A channel structure that is rising indicates a bullish trend, while a channel structure that is dropping indicates a bearish trend.
Traders can also trade reversal signals developing on the identified horizontal support and resistance lines.
Buy Trade Setup
When to Enter?
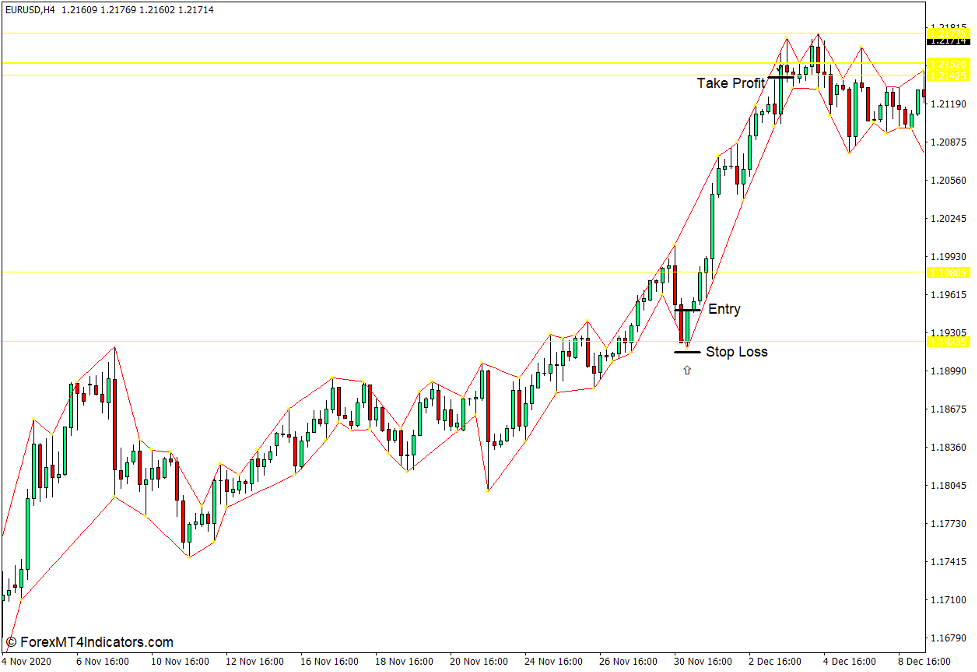
Open a buy order on a bullish reversal price action developing on a horizontal support line. Set the stop loss below the pattern.
When to Exit?
Set the take profit on the next resistance line.
Sell Trade Setup
When to Enter?
Open a sell order on a bearish reversal price action developing on a horizontal resistance line. Set the stop loss above the pattern.
When to Exit?
Set the take profit on the next support line.
Conclusion
This indicator provides a decent idea for trading based on market flow structures and price action. In fact, there is a trader who trades using the same concept on the lower timeframes only that the lines are identified manually. However, it is important that the settings of this indicator is adjusted per currency pair as the sensitivity may vary and could be overly aggressive at times.
Recommended MT4/MT5 Brokers
XM Broker
- Free $50 To Start Trading Instantly! (Withdraw-able Profit)
- Deposit Bonus up to $5,000
- Unlimited Loyalty Program
- Award Winning Forex Broker
- Additional Exclusive Bonuses Throughout The Year
>> Sign Up for XM Broker Account here <<
FBS Broker
- Trade 100 Bonus: Free $100 to kickstart your trading journey!
- 100% Deposit Bonus: Double your deposit up to $10,000 and trade with enhanced capital.
- Leverage up to 1:3000: Maximizing potential profits with one of the highest leverage options available.
- ‘Best Customer Service Broker Asia’ Award: Recognized excellence in customer support and service.
- Seasonal Promotions: Enjoy a variety of exclusive bonuses and promotional offers all year round.
>> Sign Up for FBS Broker Account here <<
(Free MT4 Indicators Download)
Click here below to download:


