The forex market is very fickle. Traders could change sentiments at any moment. Price trends could reverse with little warning. Price movements that signify a strong momentum one moment could quickly reverse the next minute.
This often creates confusion among new traders. Traders who are not familiar with the volatility that is prevalent in the forex markets are often baffled by how the market behaves. Even seasoned traders could also get lost in such market conditions.
To some traders, this constant reversal of trends and momentum price movements is a treasure trove of opportunities. Trend reversals present a unique opportunity for traders who have mastered such trading conditions.
Trend reversals mark the end of a prior trend and a possible start of a fresh trend. This allows traders to enter a trade at the beginning of a trend, and if the trade is managed correctly, they could be exiting at the end of a trend or a momentum price push. This allows them to maximize profits on each new trend.
The Keltner RSI Reversal Forex Trading Strategy trades on trend reversals coming from an extreme price condition. This increases the likelihood that the trend reversal signal will result in a fresh trend allowing traders to gain bigger yields when such trend reversals occur.
Keltner Channel
The Keltner Channel indicator is a channel envelope that helps traders identify trend, momentum, volatility, and price extremes.
It is a moving average band with an upper and lower band that moves with the moving average line, adapting to the volatility of the market.
There are many ways to compute for the midline of the Keltner Channel. The most common method is to compute for the average of the typical price, which is comprised of the high, low and close. It is often computed based on a 20-period moving average.
The outer bands are based on the Average True Range (ATR) computed over a period. The ATR is then multiplied by a preset multiple. The result is then plotted, shifted above and below the moving average line.
The midline of the Keltner Channel could be used just as a regular moving average line is used. Trends could be based on the location of price in relation to the midline as well as the slope of the line.
The outer bands could indicate momentum price breakouts and overbought or oversold market conditions. Price breaking beyond the outer lines could indicate a strong momentum. However, a prolonged stay beyond the outer lines also indicate an overbought or oversold condition which is susceptible to a mean reversal.
Relative Strength Index
The Relative Strength Index is a momentum oscillator that measures the speed of change in price movements.
The RSI is derived from the average of upward price changes over the average of downward price changes. It is then computed to normalize within a range of 0 to 100.
The RSI could be interpreted in many ways.
Since 50 is the midpoint of the range, some traders interpret an RSI line above 50 as an uptrend, and an RSI line below 50 is a downtrend.
Other traders observe that the RSI line would stay within 40 to 90 during an uptrend with the 40 to 50 zone acting as a support. On the other hand, it is also observed that the RSI line would stay between 10 to 60 during a downtrend, with the 50 to 60 zone acting as resistance.
Mean reversal traders on the other hand consider an RSI line above 70 as an overbought market condition, and an RSI line below 30 as an oversold market condition.
Trading Strategy
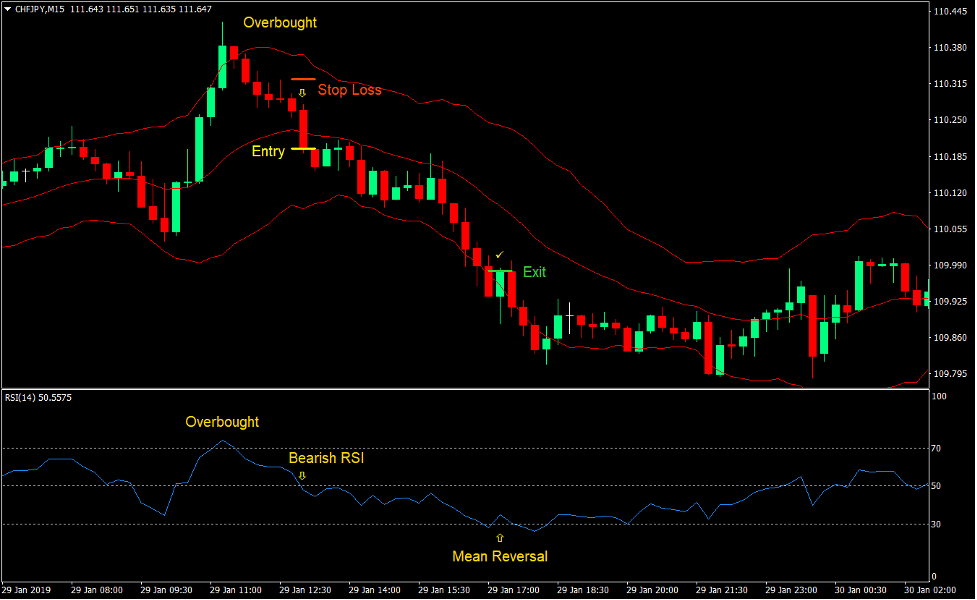
This trading strategy identifies oversold and overbought market conditions based on a confluence of signals between the Keltner Channel and the RSI.
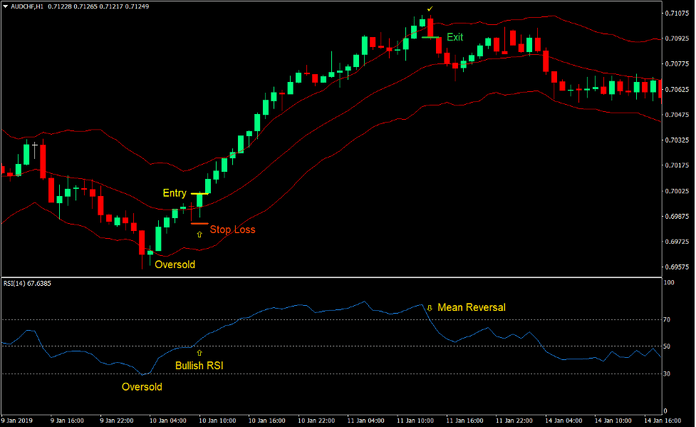
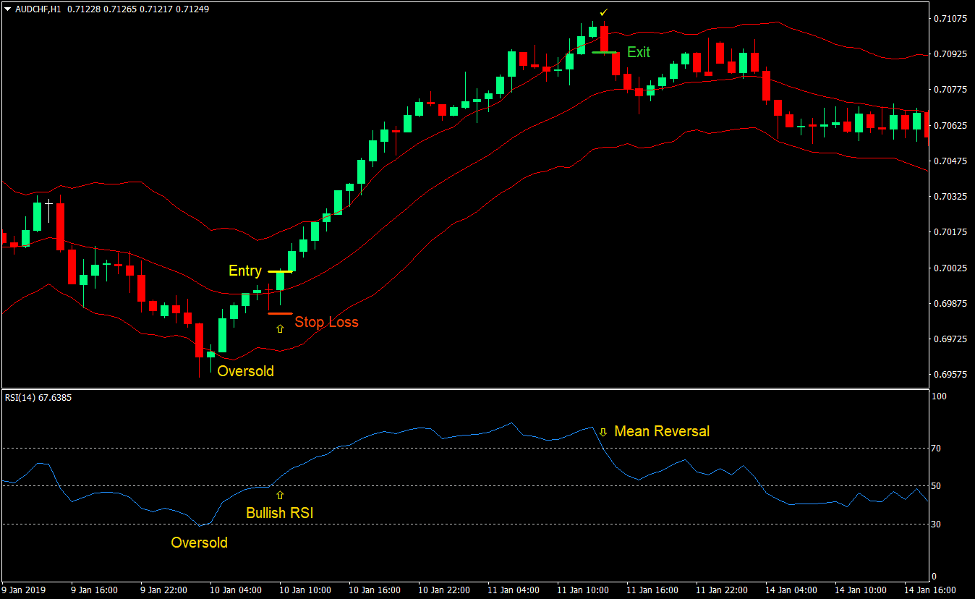
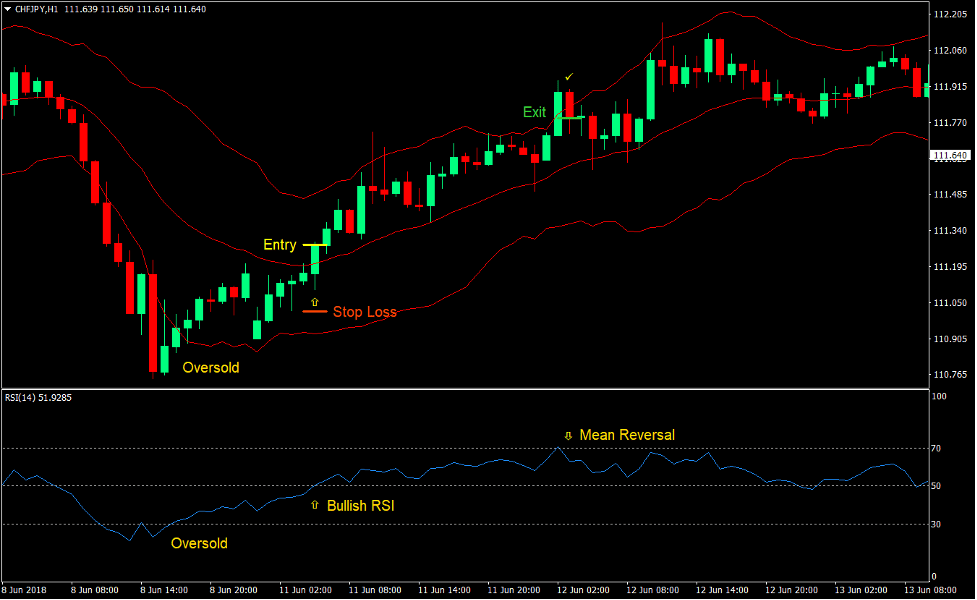
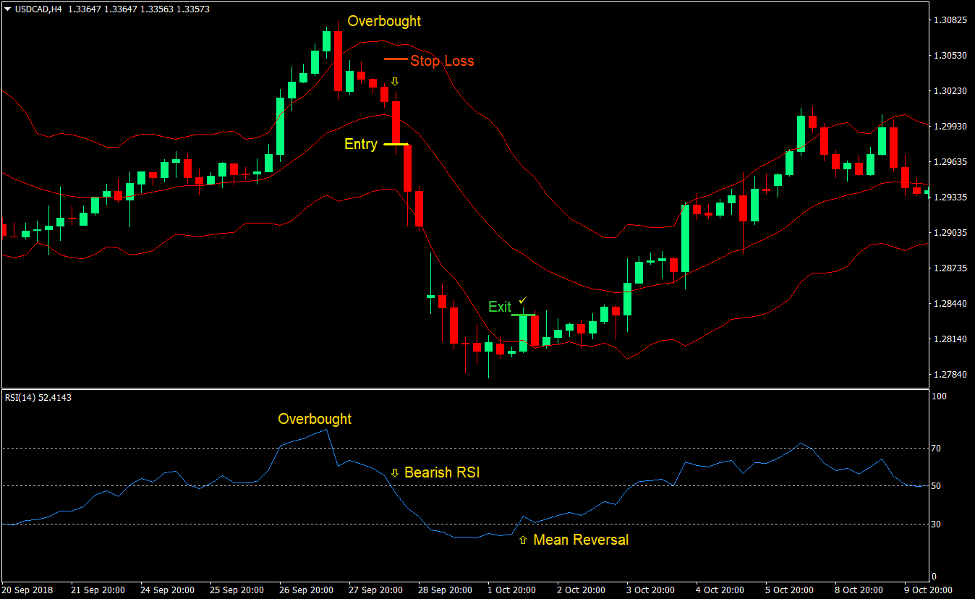
An oversold condition is read whenever price stays below the lower Keltner Channel line and the RSI line falls below 30. On the other hand, an overbought condition is read whenever price stays above the upper line of the Keltner Channel and the RSI line rises above 70.
A trend reversal signal is then interpreted as soon as price crosses the midline of the Keltner Channel and the RSI line crosses 50 coming from an overextended price condition.
Indicators:
- Keltner Chanel (default setup)
- RSI (default setup)
Preferred Time Frames: 15-minute, 30-minute, 1-hour and 4-hour charts
Currency Pairs: major and minor pairs
Trading Session: Tokyo, London and New York sessions
Buy Trade Setup
Entry
- Price should fall below the lower line of the Keltner Channel.
- The RSI line should fall below 30.
- Price should bounce off the oversold area and cross above the midline of the Keltner Channel.
- The RSI line should cross above 50 indicating a bullish trend reversal.
- The bullish trend reversal signals should be closely aligned.
- Enter a buy order on the confirmation of the conditions above.
Stop Loss
- Set the stop loss at the fractal below the entry candle.
Exit
- Close the trade as soon as the RSI line drops below 70 after breaching it indicating a mean reversal.
Sell Trade Setup
Entry
- Price should rise above the upper line of the Keltner Channel.
- The RSI line should rise above 70.
- Price should bounce off the overbought area and cross below the midline of the Keltner Channel.
- The RSI line should cross below 50 indicating a bearish trend reversal.
- The bearish trend reversal signals should be closely aligned.
- Enter a sell order on the confirmation of the conditions above.
Stop Loss
- Set the stop loss at the fractal above the entry candle.
Exit
- Close the trade as soon as the RSI line rises above 30 after breaching it indicating a mean reversal.
Conclusion
Trend reversal and mean reversal strategies are some of the most profitable types of strategies. However, not many traders have mastered the art of trading on reversals. Some traders find it difficult to trade on trend reversals because traders are often trading against an established trend.
Some traders fail because they trade on the first sign of a mean reversal instead of waiting for the confirmation of a trend reversal. The key to trading this strategy correctly is by identifying either an oversold or overbought condition and observing for a confirmation of a trend reversal. Once you get this right, you would start to have high probability trend reversal setups. Entries will have a higher accuracy. The only thing to work on to be profitable would be on exiting the trade while still in profit.
Recommended MT4 Brokers
XM Broker
- Free $50 To Start Trading Instantly! (Withdraw-able Profit)
- Deposit Bonus up to $5,000
- Unlimited Loyalty Program
- Award Winning Forex Broker
- Additional Exclusive Bonuses Throughout The Year
>> Sign Up for XM Broker Account here <<
FBS Broker
- Trade 100 Bonus: Free $100 to kickstart your trading journey!
- 100% Deposit Bonus: Double your deposit up to $10,000 and trade with enhanced capital.
- Leverage up to 1:3000: Maximizing potential profits with one of the highest leverage options available.
- ‘Best Customer Service Broker Asia’ Award: Recognized excellence in customer support and service.
- Seasonal Promotions: Enjoy a variety of exclusive bonuses and promotional offers all year round.
>> Sign Up for FBS Broker Account here <<
Click here below to download:


