


プライス アクションは取引で最も広く使用されている用語の XNUMX つですが、トレーダーごとに異なる説明があります。 エントリーシグナルとエグジットシグナルを生成する価格の基本的な動きの分析であり、インジケーターの使用を必要としないことで際立っていると示唆する人もいます. 一部のトレーダーは、時間をかけてプロットされた証券の価格の動きとしてそれを識別します. これらの説明は、一部のトレーダーにとっては明確かもしれませんが、一部の人にとっては非常に曖昧な場合もあります.
個人的には、プライス アクションを、トレンドの方向性、モメンタム、反転、継続、および発生する可能性のある他の多くの市場シナリオを示すのに役立つ、価格チャートにプロットされた価格変動の特性として説明します。 これは漠然としているかもしれませんが、これらの条件のそれぞれを精査すると、それぞれを識別するのに役立つ価格行動の特徴がわかります。 たとえば、上昇トレンドはスイング高値とスイング安値の上昇に基づいて識別できますが、下降トレンドはスイング ポイントの一定の下降によって識別できます。 勢いは、フルボディの長いろうそくを一方向に押すことで識別できます。 反転は、価格レベルに反するウィックなどの価格拒否特性に基づいて識別できます。 継続は、リトレースメントまたは収縮の直後にトレンドの方向への突然のプッシュによって識別できます.
ここでは、価格の拒否に基づいてエントリが識別されるトレンド継続シナリオを見ていきます。 純粋なプライス アクション トレーダーは、プライス アクションにはネイキッド チャートの使用が必要であると主張する場合もあります。 ただし、いくつかのテクニカル指標を使用して、適切な取引設定を特定することを妨げるルールはありません。
HAMA
HAMA、平均足移動平均、または平均足平滑化は、同じ意味で使用できます。 HAMA は、トレーダーがトレンドの方向性を明確に特定するのに役立つトレンド フォロー テクニカル インジケーターです。 価格行動の動きに非常に反応するのが特徴ですが、同時に、気まぐれすぎて誤ったシグナルを簡単に生成することもありません。
HAMA は Heiken Ashi Candlesticks の分派または派生物であり、基本的な指数移動平均 (EMA) ラインです。 トレンドの方向を示すために色が変化するバーを生成すると同時に、EMA ラインと同じ応答性でこれらのバーをプロットします。
日本語の平均足は、文字通り平均的なバーを意味します。 ある意味で、これが HAMA の役割です。 過去の価格データを平均化します。 結果の計算は、価格チャートに重ねられたバーとしてプロットされます。 トレンドの方向によってバーの色が変わります。 青いバーは強気トレンドを示し、赤いバーは弱気トレンドを示します。 したがって、色の変化は潜在的なトレンド反転を示している可能性があります。
RAVI
RAVIは基本的にRange Action Verification Indexの略です。 この指標は、取引可能な商品の基礎となる移動平均の相対的な収束または発散を表し、13 倍に増加します。 ベースの RAVI 構成は、基礎となる 13 期間の単純移動平均 (SMA) に基づいています。 当初は、3 か月に相当する XNUMX 週間の期間に基づいていました。 ただし、今日の取引の技術と速度を考えると、より低い時間枠にも適用できます。
RAVI インジケーターは、オシレーター型のテクニカル インジケーターです。 正中線ゼロを中心に振動するバーをプロットします。 正のバーは強気トレンド バイアスを示し、負のバーは弱気トレンド バイアスを示します。
トレンドの勢いの強さは、バーの色に基づいて識別することもできます. 緑のバーは強気トレンドの強さを示し、赤のバーは弱気トレンドの強さを示します。 一方、灰色のバーは、強気か弱気かを問わず、ニュートラルなモメンタムを示します。
トレーダーは、バーのシフトに基づいて、このインジケーターをトレンド反転エントリー シグナルとして使用できます。 また、トレーダーがトレンドに反する取引を避けるのに役立つトレンド方向フィルターとしても使用できます。
取引戦略
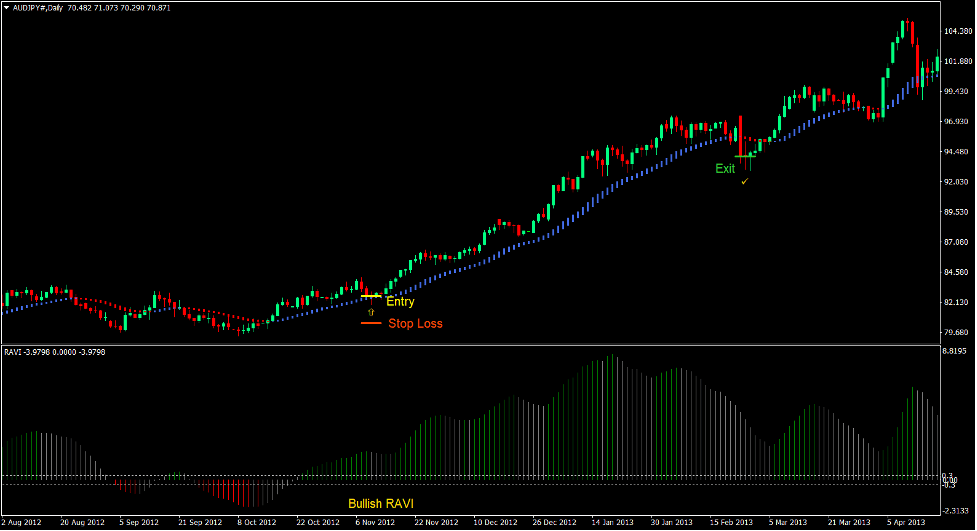
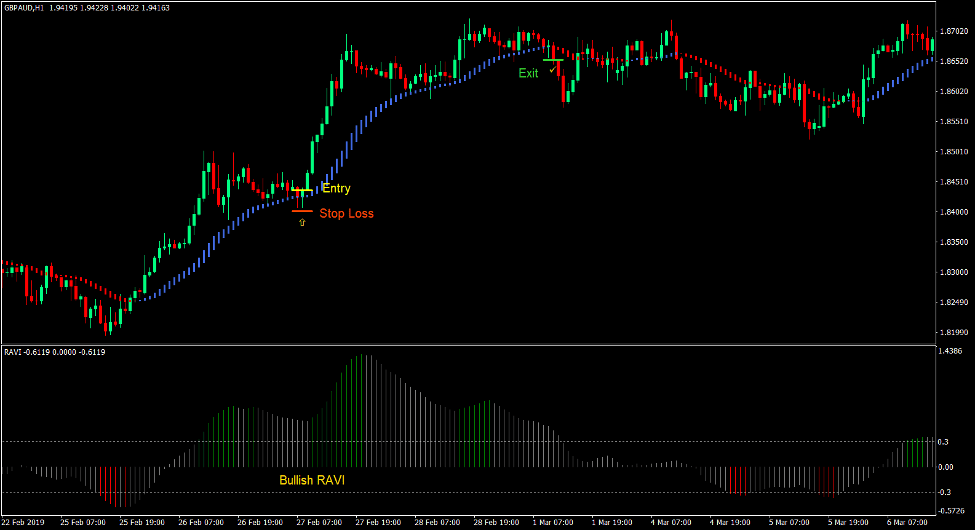
RAVI HAMA Push Forex Trading Strategy は、主なエントリーシグナルとして価格拒否を使用して、既存のトレンドの方向性で取引します。
まず、トレンドの方向は、HAMA バーの色に基づいて識別されます。 このようなトレンドの方向性は、価格アクションの上昇または下降スイング ポイント パターンに基づいて確認されます。 RAVI バーは、バーが一般的に正か負かによって、トレンドの方向性も確認する必要があります。 取引はトレンドの方向にのみ行われます。
トレンドとトレードの方向性を分離したらすぐに、価格が HAMA バーのエリアに向かって戻るのを待ちます。 価格アクションは、HAMA バーに近づくか触れると、価格拒否の兆候を示すはずです. これは、HAMA バーを押す芯に基づいています。 これがエントリーシグナルになります。
インジケータ:
- ハマ_
- ラビシグナル
優先時間枠: 30分、1時間、4時間、および毎日のチャート
通貨ペア: FXメジャー、マイナー、クロス
取引セッション: 東京、ロンドン、ニューヨークのセッション
トレードセットアップを購入する
入門
- HAMA バーは青色である必要があります。
- スイングの高値とスイングの安値は上昇しているはずです。
- RAVI バーは正でなければなりません。
- 価格は HAMA バーに向かってリトレースする必要があります.
- 価格は、それを押す芯によって示される HAMA バーの価格レベルを拒否する必要があります。
- 上記の条件を確認して、購入注文を入力します。
ストップロス
- エントリーキャンドルの下のサポートにストップロスを設定します。
- HAMA バーの下にストップロスを設定します。
出口
- HAMA バーが赤に変わったらすぐに取引を終了します。
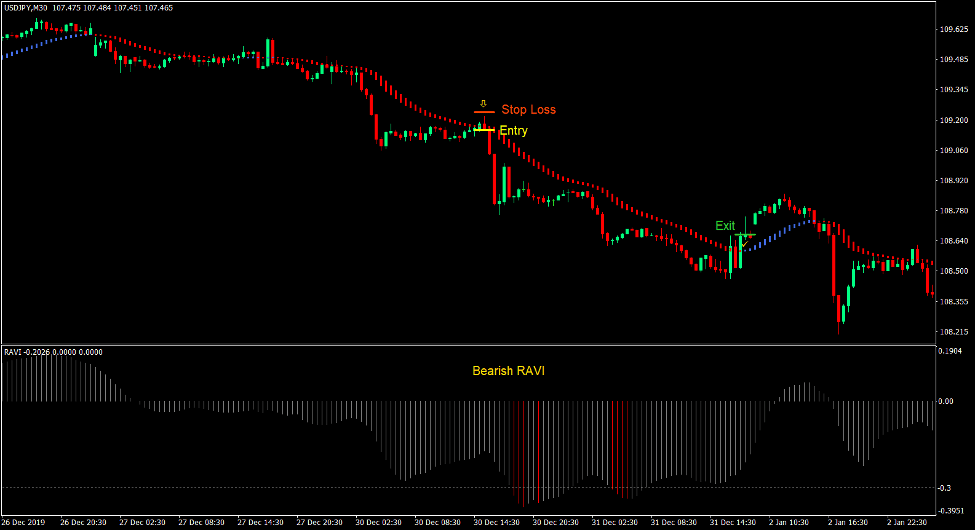
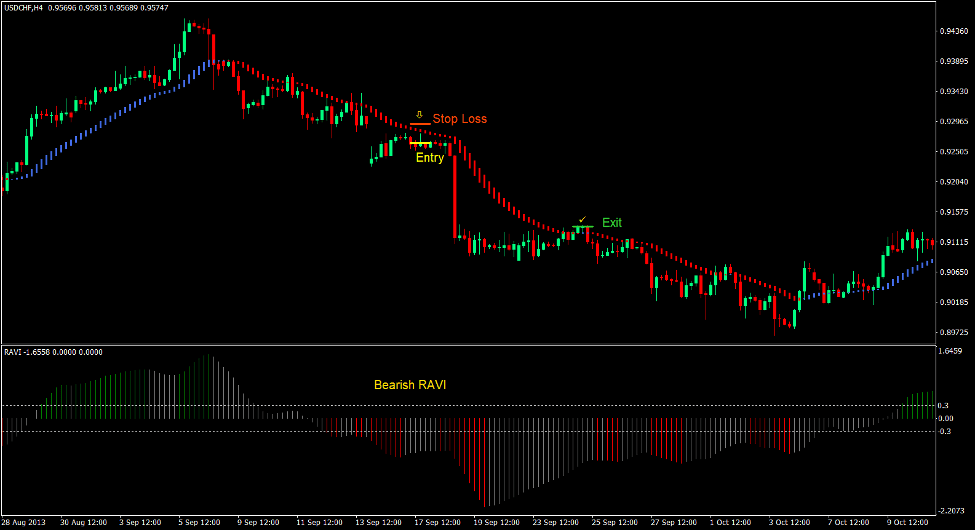
トレードセットアップを売る
入門
- HAMA バーは赤になります。
- スイングの高値とスイングの安値は低下しているはずです。
- RAVI バーはマイナスになるはずです。
- 価格は HAMA バーに向かってリトレースする必要があります.
- 価格は、それを押す芯によって示される HAMA バーの価格レベルを拒否する必要があります。
- 上記の条件を確認して、販売注文を入力します。
ストップロス
- エントリーキャンドルの上の抵抗にストップロスを設定します。
- HAMA バーの上にストップロスを設定します。
出口
- HAMA バーが青色に変わったらすぐに取引を終了します。
まとめ
この取引戦略は、基本的なトレンドフォローおよびトレンド継続戦略であり、特定のエントリーポイントを特定するために価格拒否を組み込んでいます。 これにより、トレーダーはトレンドに入るのに遅すぎるのではなく、より良い価格でエントリーすることができます.
この戦略は、適切なトレンドの市場条件で使用すると、一貫した利益を生み出すことができます.
おすすめのMT4ブローカー
XMブローカー
- 無料$ 50 すぐに取引を開始するには! (出金可能利益)
- までのデポジットボーナス $5,000
- 無制限のロイヤルティプログラム
- 受賞歴のある外国為替ブローカー
- 追加の独占ボーナス 年間を通じて

>> ここからXMブローカーアカウントにサインアップしてください<
FBSブローカー
- トレード100ボーナス: 100 ドルを無料で取引の旅を始めましょう!
- 100%の入金ボーナス: 入金額を最大 $10,000 まで XNUMX 倍にし、強化された資本で取引します。
- 1まで活用する:3000: 利用可能な最高のレバレッジ オプションの 1 つで潜在的な利益を最大化します。
- 「アジアのベストカスタマーサービスブローカー」賞: カスタマーサポートとサービスの優秀性が認められています。
- 季節のプロモーション: 一年中、さまざまな限定ボーナスやプロモーション特典をお楽しみいただけます。

>> ここからFBSブローカーアカウントにサインアップしてください<
ダウンロードするには、以下をクリックしてください。