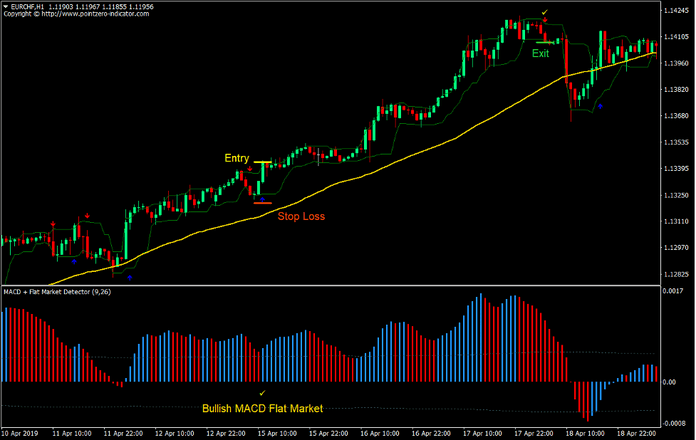
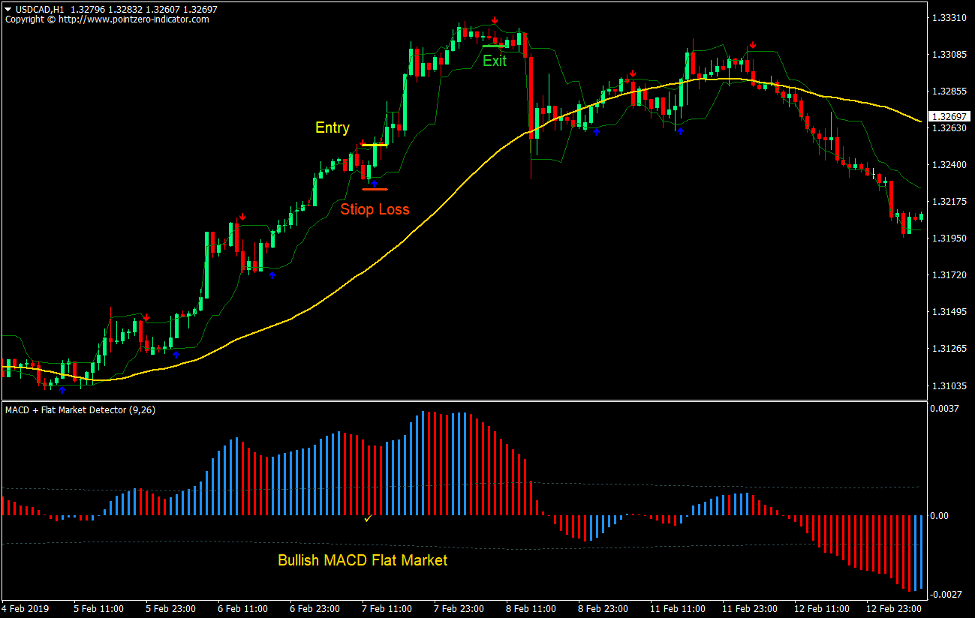
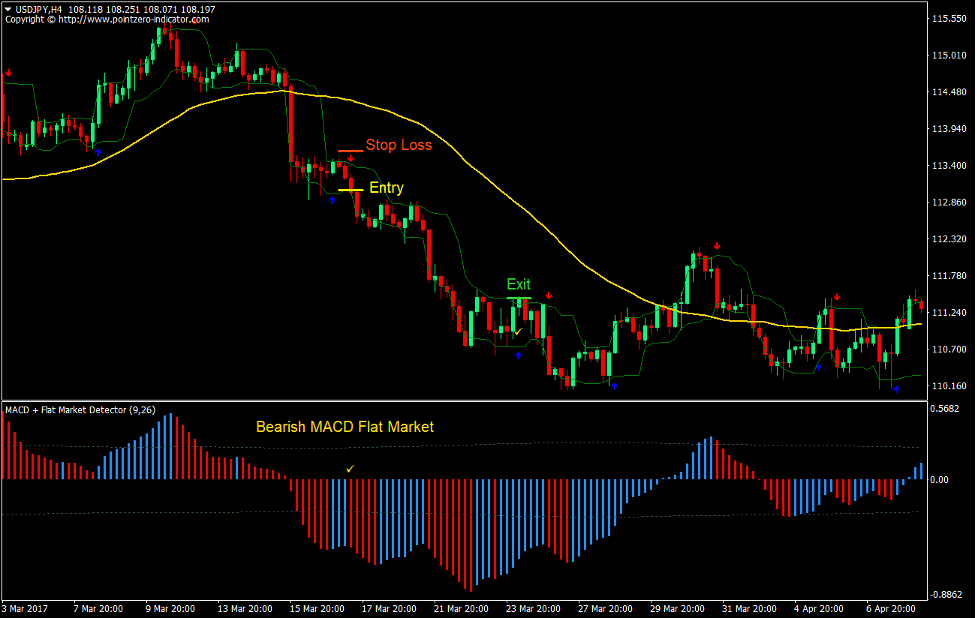
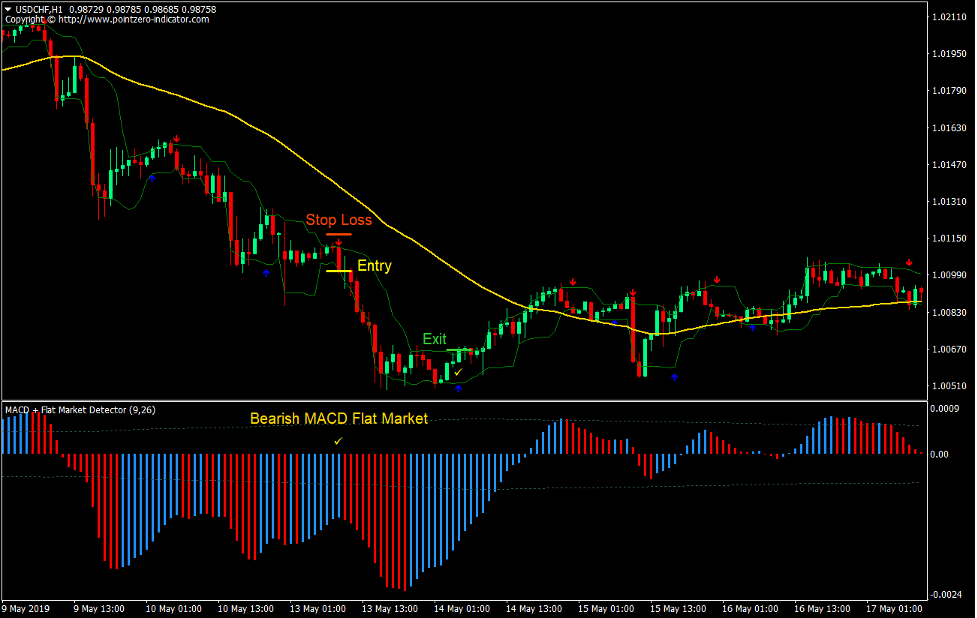
One of my favorite type of trading entries are based on momentum. This is because with momentum trading, there is always a high chance that trades would move in your favor almost instantly. Seeing a trade in green removes the pressure right away. Less pressure, less stress, less emotional decision making, less mistakes.
There are different ways to identify momentum. Some traders use breakouts. Others look for candles that signify strong momentum. Others use technical indicators.
One efficient way to identify momentum is by using channel indicators and trading on breakouts of such indicators. When you come to think of it, the most effective momentum entries are those that came from a congestion. This is because the market moves in predictable phases. It usually is a cycle between a contraction phase and an expansion phase and back again.
Using channels and bands, traders could identify such contraction phases by looking for scenarios where price is contracted between the bands. Then, as the market expands, a momentum candle would usually break out of the channel.
Arrows and Curves Momentum Forex Trading Strategy simplifies this concept by providing specific entry points based on this thesis.
Arrows and Curves Indicator
The Arrows and Curves indicator is a custom technical indicator based on a channel type of indicator.
Although it is not discussed by the author how the channel is brought about, judging by the signals it produces, this indicator is quite effective.
This indicator creates a channel like structure enveloping price action with two lines. In a normal market condition, price would typically stay within the channel. However, during a strong momentum breakout, price would typically close outside of the channel. The indicator then pinpoints such scenarios by placing an arrow on these candles. This serves as a momentum entry signal.
MACD Flat Market Detector
The MACD Flat Market Detector is a modified indicator based on the classic Moving Average Convergence and Divergence (MACD).
This indicator presents the MACD as a histogram. This represents the difference between the MACD line and the signal line. A positive histogram indicates a bullish market bias, while a negative histogram indicates a bearish market bias.
The classic MACD is limited by its inability to identify a flat market scenario or a scenario wherein momentum and volatility is low. MACD Flat Market Detector addresses this concern by including a marker to identify if the market has momentum or not. It plots a dashed line on the MACD histogram window marking the point where the market could be considered to have momentum. If the histograms breach the dashed lines, then the market could be considered to have momentum, while if the histograms stay within the range of the dashed lines, then the market could be contracting.
Trading Strategy
This trading strategy is a momentum breakout strategy based on a modified channel indicator, which is the Arrows and Curves indicator.
To trade this strategy with a relatively high probability, trades should be taken in line with the trend. We will be using the 50-period Simple Moving Average (SMA) to identify trend direction. The trend will be judged based on the location of price in relation to the trend as well as the slope of the 50 SMA line. The trend should also be visually judged based on how price action is moving.
We will then wait for a breakout from the Arrows and Curves channel indicated by an arrow pointing the same direction as the trend.
Not all trade signals would have momentum behind it. We will filter out trades with low momentum using the MACD Flat Market Detector. The histogram bars of the MACD Flat Market Detector should breach the dashed lines indicating a strong momentum.
Indicators:
- 50 SMA (Gold)
- lukas1_Arrows_Curves (default setting)
- MACD_FlatMarketDetector (default setting)
Preferred Time Frames: 1-hour and 4-hour charts
Currency Pairs: major and minor pairs
Trading Sessions: Tokyo, London and New York sessions
Buy Trade Setup
Entry
- Price should be above the 50 SMA line.
- The 50 SMA line should be sloping up.
- The histogram bars on the MACD Flat Market Detector should be positive and should close above the upper dashed line.
- Enter a buy order as soon as the Arrows and Curves indicator prints an arrow pointing up.
Stop Loss
- Set the stop loss below the lower line of the channel.
Exit
- Close the trade as soon as the Arrows and Curves indicator prints an arrow pointing down.
Sell Trade Setup
Entry
- Price should be below the 50 SMA line.
- The 50 SMA line should be sloping down.
- The histogram bars on the MACD Flat Market Detector should be negative and should close below the lower dashed line.
- Enter a sell order as soon as the Arrows and Curves indicator prints an arrow pointing down.
Stop Loss
- Set the stop loss above the upper line of the channel.
Exit
- Close the trade as soon as the Arrows and Curves indicator prints an arrow pointing up.
Conclusion
This strategy is a profitable trading strategy that works well during regularly trending market conditions.
During these types of trending market, price movement is usually a cycle of an expansion in the direction of the trend and a contraction phase which could either be a sideways price action or a retracement. Expansion phases are usually initiated by momentum candles breaking out of a tight range, which is exactly what most of these signals are.
For the most part, when used in the correct trading environment, this trading strategy should produce consistently profitable trades. However, there are cases when a setup would return a loss, but these losses are very minimal compared to the potential profits coming from good trades.
Recommended MT4 Brokers
XM Broker
- Free $50 To Start Trading Instantly! (Withdraw-able Profit)
- Deposit Bonus up to $5,000
- Unlimited Loyalty Program
- Award Winning Forex Broker
- Additional Exclusive Bonuses Throughout The Year
>> Sign Up for XM Broker Account here <<
FBS Broker
- Trade 100 Bonus: Free $100 to kickstart your trading journey!
- 100% Deposit Bonus: Double your deposit up to $10,000 and trade with enhanced capital.
- Leverage up to 1:3000: Maximizing potential profits with one of the highest leverage options available.
- ‘Best Customer Service Broker Asia’ Award: Recognized excellence in customer support and service.
- Seasonal Promotions: Enjoy a variety of exclusive bonuses and promotional offers all year round.
>> Sign Up for FBS Broker Account here <<
Click here below to download:


