Trading strategies could be classified into two. The first type of strategy are strategies that trade with the trend or with the flow of momentum. The second type of strategy are reversals. These classifications would then branch out to different types of strategies. Momentum strategies could either be a breakout strategy, retracements, trend-following, trend continuation pattern trading, etc. Reversals on the other hand could be trend reversals, mean reversals, support and resistance reversals, reversal pattern trading, etc.
Traders would often take different approaches based on those mentioned above. Some would trade solely based on momentum while others trade solely based on reversals. Some would even combine different approaches for more confluences and confirmations. Rarely would you see trading strategies that would combine momentum and reversal. This is because these two strategies seem to be opposites. However, combining these two opposites could also be beneficial. This is because you are taking confluences that comes from different perspectives and trading in the direction where both styles of trading would seem to agree.
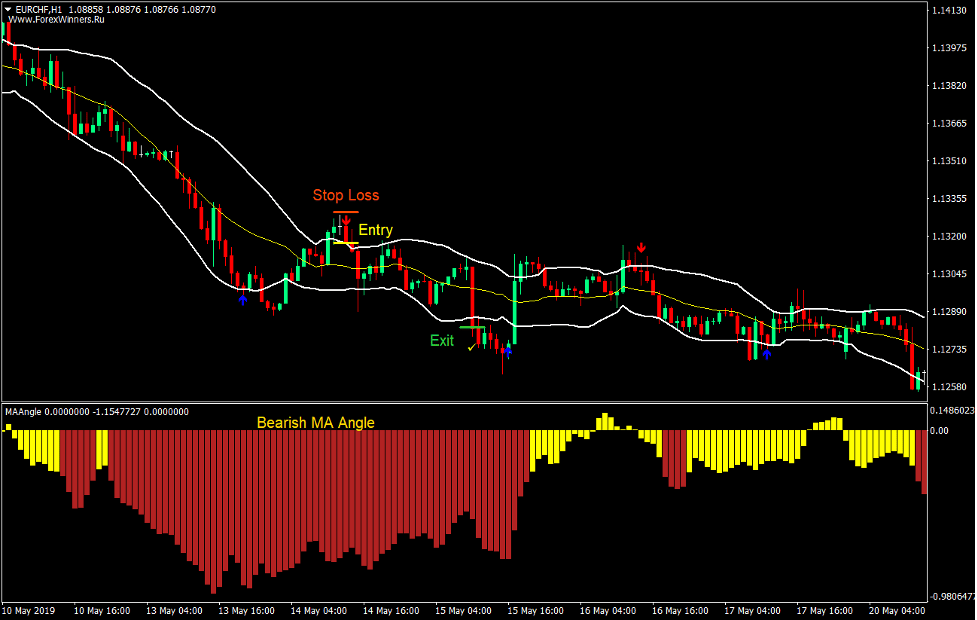
Arrows and Bands Forex Trading Strategy is a strategy that combines a trend following strategy and mean reversal. It bases its trade direction bias based on the direction of the trend. Then it identifies trade entries based on a possible mean reversal signal. It makes use of a trend-following indicator as a trend filter and a mean reversal indicator to identify trade entry signals.
MA BBands Indicator
MA BBands is a custom technical indicator based on the Bollinger Bands, moving averages and Oscillator of Moving Averages (OsMA).
This indicator is plotted much like a Bollinger Band indicator. It plots the midline based on a moving average much like the classic Bollinger Band would. This version however allows traders to change the type of moving average used and shift the moving average left or right. It also plots the outer lines based on a standard deviation. Comparing the outer bands of this indicator to the classic Bollinger Bands, this indicator plots smoother outer lines.
The indicator also plots arrows indicating probable mean reversal signals. These arrows are based on reversals coming from the Oscillator of Moving Averages occurring outside of the band.
This indicator could be used as a momentum indicator and a trend following indicator much like the classic Bollinger Bands. However, where it shines most is in providing mean reversal signals. Entry signals provided by this indicator tend to be very reliable and could produce high quality trade setups.
MA Angle Indicator
The MA Angle indicator is a trend following oscillating indicator. It helps traders identify the direction of the trend based on the slope of a moving average line.
The MA Angle indicator computes for the difference between a moving average and its duplicate which is shifted forward. It then plots bars on a separate window. Positive bars generally indicate a bullish bias while negative bars generally indicate a bearish bias. However, the indicator also has an Angle Threshold which helps filter out non-trending markets. It plots yellow bars for non-trending markets, lime green bars to indicate a bullish bias, and fire brick bars to indicate a bearish bias.
The indicator has several parameters that makes it very customizable. Traders could modify the type of moving average used, the number periods, the threshold of the angle, and the shift of the moving average lines.
Trading Strategy
To trade this strategy, first we would have to filter our trades based on trend direction bias. This is because we will be trading only on markets that are showing clear trend directions.
To do this, we will be using the MA Angle indicator. Trend direction will be filtered based on the color of the histogram bars. If the bars are lime green, only buy trade setups should be considered. If the bars are fire brick, then only sell trades will be considered.
The MA Angle indicator should only be a confirmation of trend direction. We should visually identify if price action is trending up or down. We could identify this by looking at whether price action is making higher or lower swing highs and swing lows.
If we have established trend direction bias, we will then look for specific entry points based on mean reversals. To simplify the process, we will be using the MA BBands indicator. Entry signals will simply be based on the entry signal arrows plotted by the MA BBands indicator.
Indicators:
- MA_BBands
- MA Period: 18
- OsMA: 9
- MA Angle
- MA Period: 55
Preferred Time Frames: 1-hour, 4-hour and daily charts
Currency Pairs: FX majors, minors and crosses
Trading Sessions: Tokyo, London and New York sessions
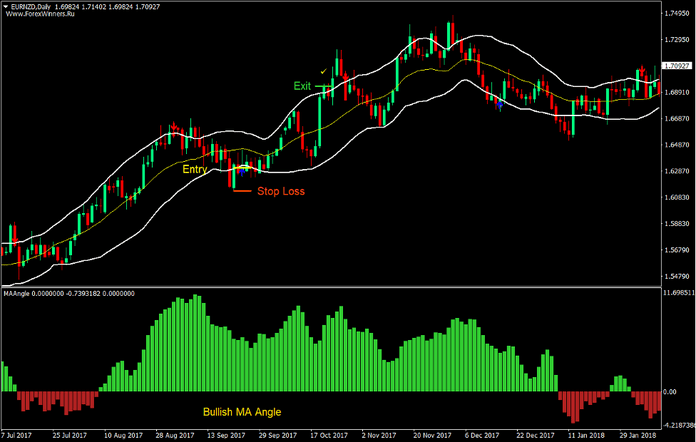
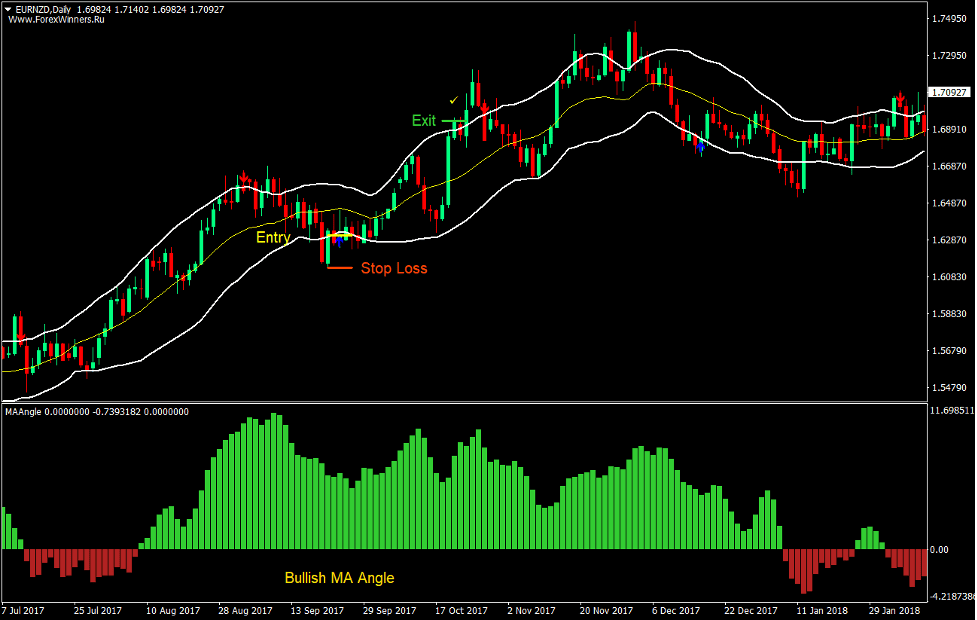
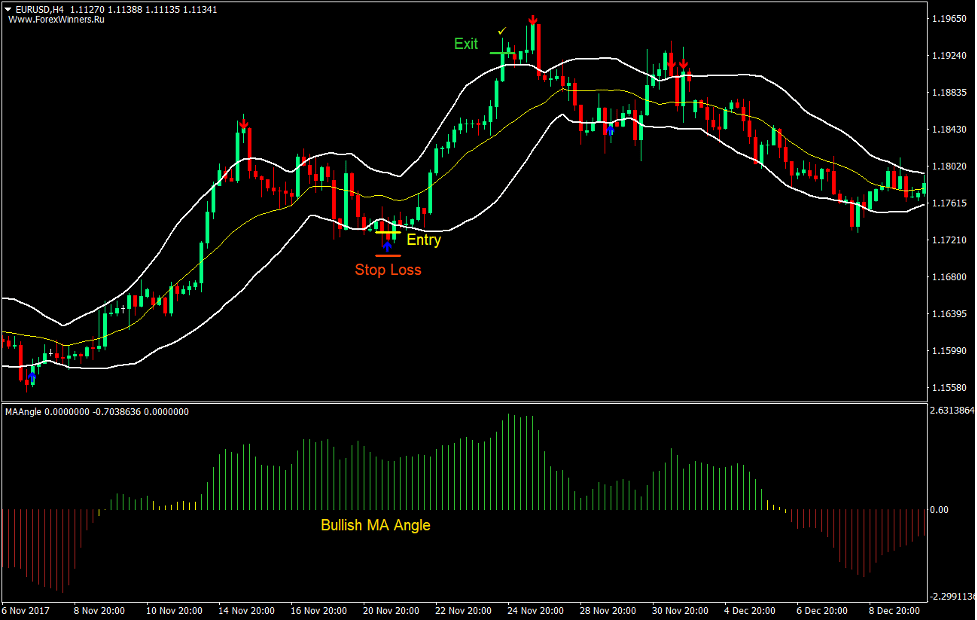
Buy Trade Setup
Entry
- The MA Angle indicator should be plotting positive lime green bars.
- Price should retrace below the lower outer band of the MA BBands indicator.
- The MA BBands indicator should plot an arrow pointing up.
- Enter a buy order on the confirmation of the conditions above.
Stop Loss
- Set the stop loss on the fractal below the entry candle.
Exit
- Close the trade as soon as price closes above the upper outer line of the MA BBands indicator.
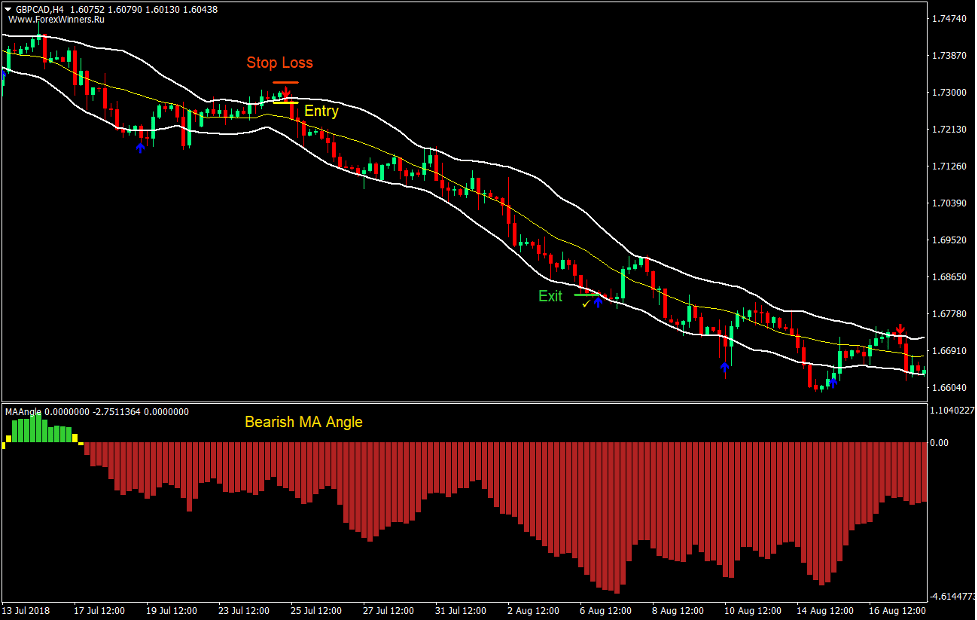
Sell Trade Setup
Entry
- The MA Angle indicator should be plotting negative fire brick bars.
- Price should retrace above the upper outer band of the MA BBands indicator.
- The MA BBands indicator should plot an arrow pointing down.
- Enter a sell order on the confirmation of the conditions above.
Stop Loss
- Set the stop loss on the fractal above the entry candle.
Exit
- Close the trade as soon as price closes below the lower outer line of the MA BBands indicator.
Conclusion
This trading strategy is a high probability trading strategy.
Most mean reversal strategies are high probability trading strategies. This is because price would usually reverse back to its mean after being overextended.
Not only is this strategy a high probability strategy, it is also able to produce trades with high yields. This is because trades are taken in the direction of the trend. If price would gradually be pushing in the direction of the trend, yields could gradually grow bigger.
This combination of a decent win rate and reward-risk ratio could help make traders become consistently profitable as long as it is used in the right market condition.
Recommended MT4 Brokers
XM Broker
- Free $50 To Start Trading Instantly! (Withdraw-able Profit)
- Deposit Bonus up to $5,000
- Unlimited Loyalty Program
- Award Winning Forex Broker
- Additional Exclusive Bonuses Throughout The Year
>> Sign Up for XM Broker Account here <<
FBS Broker
- Trade 100 Bonus: Free $100 to kickstart your trading journey!
- 100% Deposit Bonus: Double your deposit up to $10,000 and trade with enhanced capital.
- Leverage up to 1:3000: Maximizing potential profits with one of the highest leverage options available.
- ‘Best Customer Service Broker Asia’ Award: Recognized excellence in customer support and service.
- Seasonal Promotions: Enjoy a variety of exclusive bonuses and promotional offers all year round.
>> Sign Up for FBS Broker Account here <<
Click here below to download:


