


Price Channel Indicator, is a versatile tool that aids in identifying trends, assessing volatility, and making informed trading decisions. In this comprehensive guide, we delve into the intricacies of the Price Channel Indicator for MetaTrader 5 (MT5), exploring its construction, interpretation, and practical applications.
Defining Price Channels
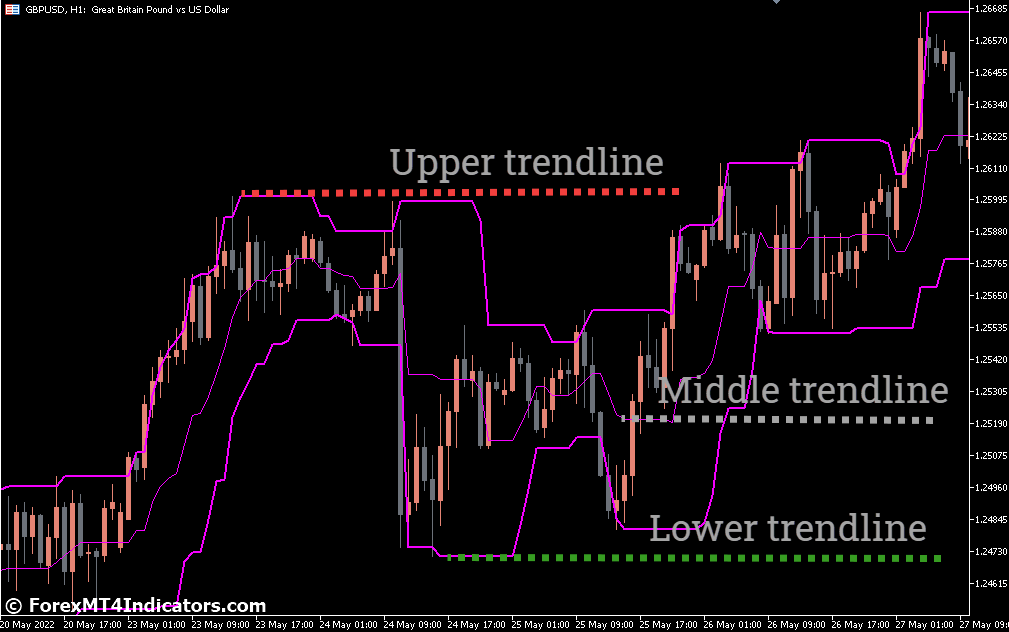
At its core, the Price Channel Indicator assists traders in visualizing price movements within a defined range. Imagine drawing parallel lines above and below a price chart, encapsulating the price action. These lines represent the upper and lower boundaries of the price channel. When prices oscillate within these confines, traders gain valuable insights into potential breakouts, reversals, and trend continuation.
Maximal And Minimal Prices
The Price Channel Indicator calculates its upper and lower boundaries based on the highest and lowest prices observed over a specified period. By connecting these extreme points, the indicator draws a channel that adapts to market fluctuations. Traders can customize the look-back period to suit their trading style, whether short-term or long-term.
Horizontal, Ascending, and Descending
- Horizontal Channels: When prices move sideways, forming a flat channel, we have a horizontal price channel. Traders use this pattern to anticipate potential breakouts.
- Ascending Channels: In an ascending channel, the lower boundary slopes upward, indicating bullish momentum. As prices consistently make higher lows, traders watch for opportunities to enter long positions.
- Descending Channels: Conversely, descending channels feature a downward-sloping upper boundary. Here, bearish sentiment prevails, and traders look for short-selling opportunities.
The Art Of Price Channel Breakouts
- Bullish Breakouts: When prices breach the upper channel boundary, it signals potential upward momentum. Traders may consider buying opportunities.
- Bearish Breakouts: Conversely, a breach of the lower boundary suggests bearish pressure. Traders watch for short-selling chances.
Fine-Tuning Your Indicator
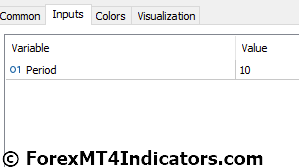
Choose the look-back period (number of bars) for calculating the channel. Shorter periods capture recent price action, while longer periods provide a broader perspective.MT5 allows traders to adjust line colors, styles, and thickness to enhance visibility.
Beyond The Lines
Narrow channels indicate low volatility while widening channels suggest increased market activity. Pay attention to price interactions with the channel boundaries. A bounce off the lower boundary may signal a bullish reversal, while a rejection at the upper boundary hints at potential bearish pressure.
Synergy In Trading
Overlaying moving averages with the Price Channel Indicator provides additional confirmation. Bullish crossovers near the lower boundary strengthen buy signals. Use these oscillators to validate price channel breakouts and divergences.
Chart Analysis In Action
Let’s explore real-world charts, applying the Price Channel Indicator to currency pairs, stocks, or commodities. Observe how the indicator interacts with price movements and enhances decision-making.
Navigating The Crypto Seas
Explore how the Price Channel Indicator applies to cryptocurrencies. Analyze historical crypto charts and adapt your trading approach accordingly. Understand why crypto markets experience extreme volatility and how the Price Channel can guide your decisions during these turbulent times.
How to Trade with Price Channel Indicator
Buy Entry
- Wait for the price to close above the upper channel.
- Look for a confirmation candle (such as a bullish engulfing pattern or a strong bullish candle).
- Enter the trade at the opening of the confirmation candle.
- Set the stop-loss just below the recent low.
- Consider setting a take-profit based on your risk-reward ratio or a significant resistance level.
Sell Entry
- Wait for the price to close below the lower channel.
- Look for a confirmation candle (such as a bearish engulfing pattern or a strong bearish candle).
- Enter the trade at the opening of the confirmation candle.
- Set the stop-loss just above the recent high.
- Consider setting a take-profit based on your risk-reward ratio or a significant support level.
Price Channel Indicator Settings
Conclusion
Price Channel Indicator, we’ve explored its construction, applications, and nuances. Remember that no single tool guarantees success; the synergy of knowledge, experience, and discipline leads to profitable trading. As you set sail in the vast ocean of financial markets, may the Price Channel be your guiding star.
Recommended MT5 Brokers
XM Broker
- Free $50 To Start Trading Instantly! (Withdraw-able Profit)
- Deposit Bonus up to $5,000
- Unlimited Loyalty Program
- Award Winning Forex Broker
- Additional Exclusive Bonuses Throughout The Year

>> Sign Up for XM Broker Account here <<
FBS Broker
- Trade 100 Bonus: Free $100 to kickstart your trading journey!
- 100% Deposit Bonus: Double your deposit up to $10,000 and trade with enhanced capital.
- Leverage up to 1:3000: Maximizing potential profits with one of the highest leverage options available.
- ‘Best Customer Service Broker Asia’ Award: Recognized excellence in customer support and service.
- Seasonal Promotions: Enjoy a variety of exclusive bonuses and promotional offers all year round.

>> Sign Up for FBS Broker Account here <<

(Free MT5 Indicators Download)
Click here below to download: