


Channel based or band based technical indicators are the types of indicators that I have completely overlooked when I first started out trading. I thought having all those lines were confusing and it made it hard for me to see patterns. However, that was a mistake. Indicators that have bands and channels could be some of the most effective indicators available for traders.
Channel and band-based indicators are some of the most complete indicators that traders could use. It has almost everything that a trader would need. It identifies trend direction, momentum, dynamic supports and resistances, overbought and oversold prices and a whole lot more. It all depends on how traders interpret it and make use of such information.
Having all this information coming from one indicator gives traders a unique appreciation of what the market is doing. It allows traders to decide based on a more complete information giving them an edge over the market.
The Keltner Channel TTF Forex Trading Strategy is a strategy that is based on such type of technical indicator.
Keltner Channel
The Keltner Channel is a technical indicator which provides information on trend, momentum and volatility.
This indicator is composed of three lines. The middle line is an Exponential Moving Average (EMA) based on the price close of a preset number of periods.
The outer bands are based on the Average True Range (ATR) displaced above and below the EMA based on a multiple of the ATR. Typically, the ATR is multiplied by two and the is added to the EMA to form the upper line. The lower line is based on the ATR multiplied by two and is subtracted from the EMA.
Because the outer lines are based on the ATR, the bands tend to expand and contract depending on the volatility of the market.
Often, price would stay within the range of the bands. During an uptrend, price would usually stay on the upper half of the channel, while during a downtrend, price would stay on the lower half of the channel.
At times, price would move outside the channel. This could signify an overbought or oversold price condition or could signify an acceleration in momentum.
Trend Trigger Factor
The Trend Trigger Factor (TTF) is a trend following and momentum-based technical indicator developed by M.H. Pee.
The idea behind this indicator is that price movement is mostly random in nature, with a small component of a trend. Traders should be able to identify these trending market conditions in order to profit from the market using a trend following strategy. To identify trend direction, the indicator tries to identify the strength of the bull and bear trends.
The Buy and Sell Power is based on the difference of the highest high and lowest low within a certain period. The Trend Trigger Factor is then derived from the difference between the Buy and Sell Power.
The indicator then displays its readings as an oscillator with histogram bars. Positive bars indicate an uptrend while negative bars indicate a downtrend.
Inverse Distance Weighted Moving Average
The Inverse Distance Weighted Moving Average (IDWMA) is a modified moving average indicator.
Price movements during low volatility market conditions are usually choppy. This often results in false signals when using classic moving averages. The IDWMA was developed in order to address this problem with choppy low volatility markets and moving averages.
The IDWMA is a moving average indicator that puts weight on significant price movements over small price movements. It does so by measuring the distance of the close of price from the average price. The farther the current price is from the mean, the heavier the weight assigned to it by the indicator.
This creates a moving average line that responds strongly on significant momentum candles and stays relatively flat during low volatility choppy markets.
Trading Strategy
This trading strategy provides trade signals based on the crossover of the IDWMA line with the middle line of the Keltner Channel.
Crossovers between the two line usually signify a trend change with momentum. Often, whenever the IDWMA line crosses over the midline of the Keltner Channel, price would stay on the half of the channel where the trend is going.
The TTF indicator also confirms such market scenarios. The TTF bars would also typically remain bullish or bearish whenever there is a strong momentum price movement that caused the IDWMA line to cross the midline of the Keltner Channel.
For this reason, trade signals will be based on the confluence between the crossover of the IDWMA line and the Keltner Channel, and the trend reversal signals coming from histogram bars of the TTF indicator.
Indicators:
- TTF_hist
- TTFbars: 18
- Keltner_Channel (default settings)
- IDWma (default settings)
Preferred Time Frames: 15-minutes, 30-minutes, 1-hour and 4-hour charts
Currency Pairs: major and minor pairs
Trading Session: Tokyo, London and New York sessions
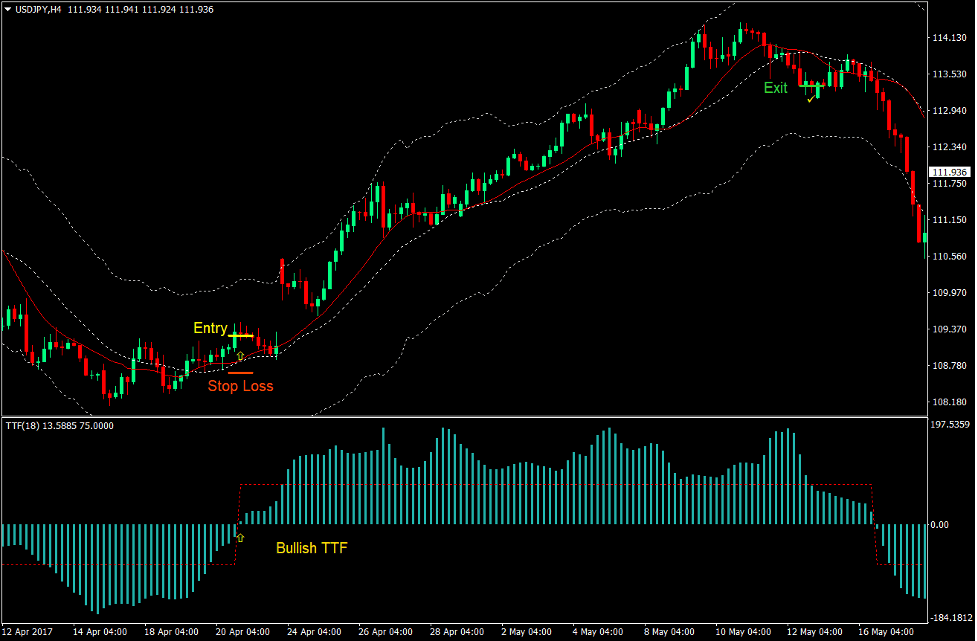
Buy Trade Setup
Entry
- Price should cross above the IDWMA line (red) and the midline of the Keltner Channel.
- The IDWMA line should cross above the midline of the Keltner Channel.
- The TTF indicator should print positive bars.
- These bullish signals should be closely aligned.
- Enter a buy order on the confirmation of the conditions above.
Stop Loss
- Set the stop loss on the fractal below the entry candle.
Exit
- Close the trade as soon as the IDWMA line crosses below the midline of the Keltner Channel.
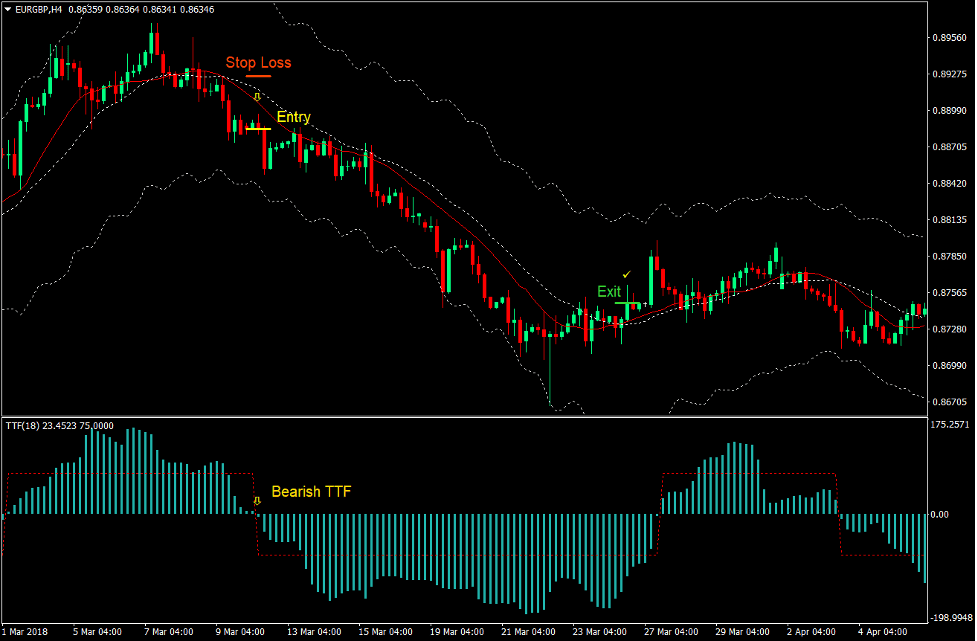
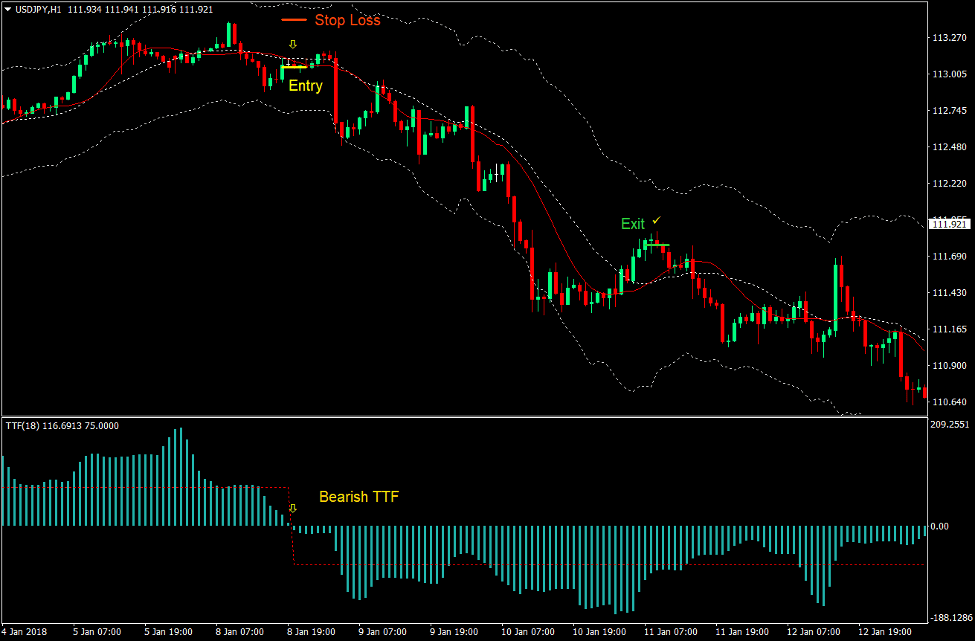
Sell Trade Setup
Entry
- Price should cross below the IDWMA line (red) and the midline of the Keltner Channel.
- The IDWMA line should cross below the midline of the Keltner Channel.
- The TTF indicator should print negative bars.
- These bearish signals should be closely aligned.
- Enter a sell order on the confirmation of the conditions above.
Stop Loss
- Set the stop loss on the fractal above the entry candle.
Exit
- Close the trade as soon as the IDWMA line crosses above the midline of the Keltner Channel.
Conclusion
This trading strategy works well when used in conjunction with other price action-based strategies. Traders could trade this on trend reversals coming from a breakout or breakdown of a support or resistance line.
Seasoned traders could profit even more if they could exit the trade earlier based on price candle patterns or other price action analysis. Beginner traders on the other hand could stick with these rules and earn big profits during strong momentum price movements that would result in a trend.
Recommended MT4 Brokers
XM Broker
- Free $50 To Start Trading Instantly! (Withdraw-able Profit)
- Deposit Bonus up to $5,000
- Unlimited Loyalty Program
- Award Winning Forex Broker
- Additional Exclusive Bonuses Throughout The Year

>> Sign Up for XM Broker Account here <<
FBS Broker
- Trade 100 Bonus: Free $100 to kickstart your trading journey!
- 100% Deposit Bonus: Double your deposit up to $10,000 and trade with enhanced capital.
- Leverage up to 1:3000: Maximizing potential profits with one of the highest leverage options available.
- ‘Best Customer Service Broker Asia’ Award: Recognized excellence in customer support and service.
- Seasonal Promotions: Enjoy a variety of exclusive bonuses and promotional offers all year round.

>> Sign Up for FBS Broker Account here <<
Click here below to download: