


Brexit is a major event that most traders are waiting. Traders are waiting for an opportunity to make money during this event. There are strategies that traders must know refer to take advantage of this wonderful opportunity. Five forex strategies are provided for you in this website.
You don’t have to use all these strategies. Just use one because these 5 forex strategies varies depending on every different market conditions before the Brexit vote are released. If condition 1 occur, then you can use strategy 1, or if condition 2 happens, then use strategy 2 and so on.
Let’s get to the definition of the Brexit. Brexit is the shortened name of “British exit”. The decision was last June 23, 2016. On this date, no one doesn’t have any clue on what is going to happen. The vote is was either to remain as a member or to exit of European Union. This event created so much news.
Who should cares about BREXIT?
British was already strong before the British joined European Union. Traders do care so much about this exit because in this news event, traders can make money on this whether the market goes up or down. Huge money was earned during the release of this news.
How will the Brexit affect the GBP? (British Pound)
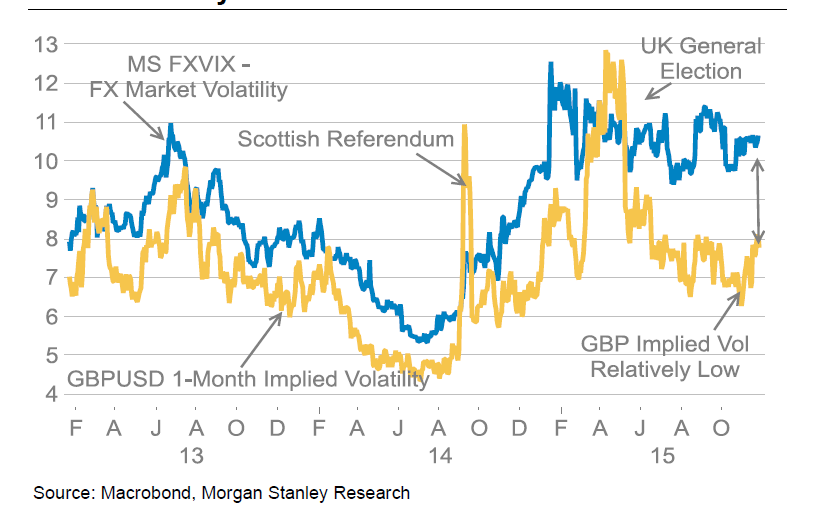
There was lots of discussion happened before the event. Especially if British leaves European Union.
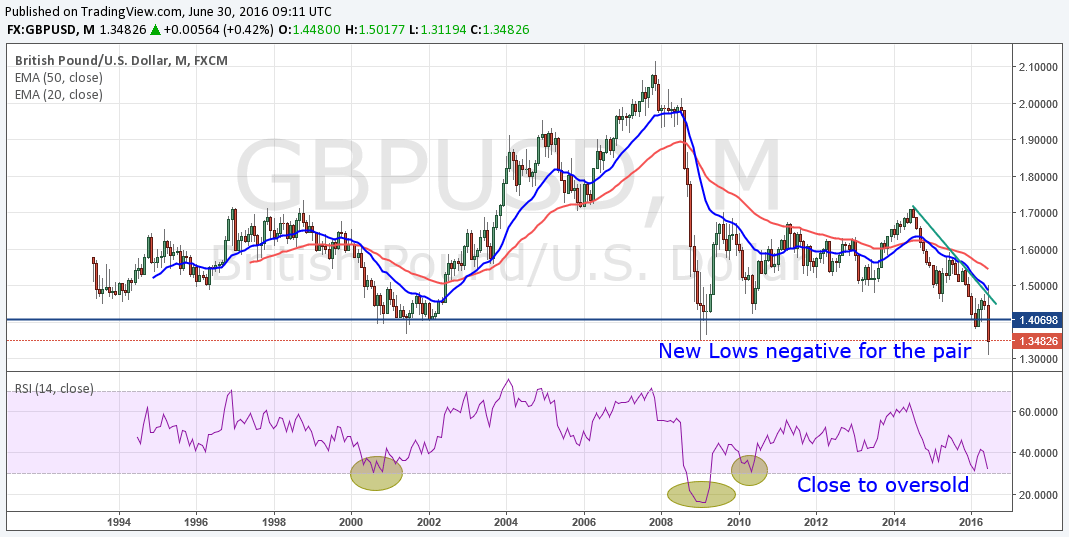
There is a lot of argument going on the moment about how the Pound will be affected if Britain leaves European Union. According to Mark carney, if the British public vote to leave EU then Pound is most likely to drop. Selling opportunity was expected during that event and it has a huge impact to all GBP pairs. EURGBP was the most focused pairs because this event was all about Euro and British Pound. GBPUSD dropped also during the release of this event.
How to trade on the Brexit?
The suggested strategy that was used was looking EURGBP on a higher timeframe such as daily or H4. Buy stop and sell stop were placed a bit further on the outer edges of price consolidations, support and resistance levels before the news was released.
If breakout occurs, may it be upward or downward, one of the pending orders was bound to catch that price move whichever direction price goes. There are 5 more types of forex trading startegies that can be used to trade the Brexit.
7 FOREX STRATEGIES FOR BREXIT
#1 – Slow Moving Average Strategy
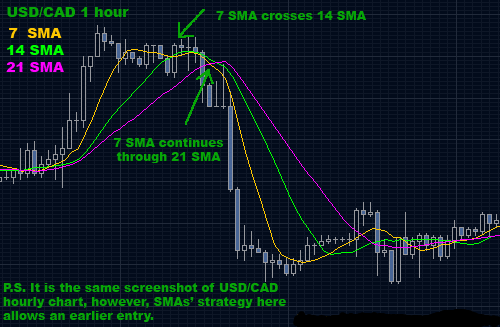
Timeframes that can be use in this strategy are 1 hour, daily, or any) and indicators that will be used are:
(Multiple of 7) SMA (Slow Moving Average) 7
SMA 14
SMA 21
Rules for entry:
7 SMA must go through 12 and continues through 21.
Buy/Sell in the direction of 7 SMA when price gets through SMA 21.
Rules for exit:
Get out when 7 SMA goes back and respects SMA 21.
Advantages:
It doesn’t require a lot of thinking and calculations
Can produce very good results during strong market moves.
Can easily be programmed and traded automatically.
Disadvantage:
Monitoring must be required to a chosen timeframe.SMA indicator signal is fixed, traders may rely on such information to open trade.
Click here below to download:
Slow Moving Averages Crossover Trading Strategy
#2 – Stochastic High-Low Trading Strategy
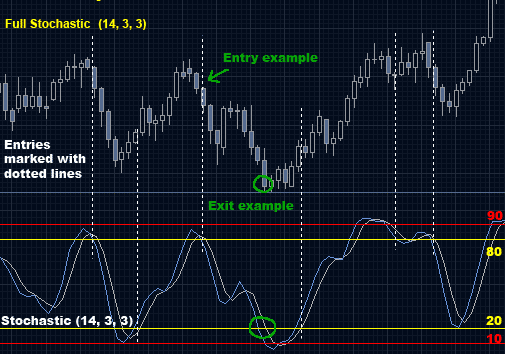
Stochastic indicator provide tips about the market situation for trades that are determined to see it. You can trade any currency using this system and any timeframe will do.
List of indicators:
Full Stochastic (14, 3,3)
Rules for Buy entry:
Stochastic must cross below 20 and reach 10, then crossed back up to 20.
Rules for Sell entry:
Stochastic must crossed down above 80 and reach 90 then crossed back down to 80.
Exit rules:
Exit position when stochastic lines reach the opposite (80-buy, 20-sell)
Advantages:
Gives accurate entry or exit signals a trending market.
Disadvantage:
Needs more monitoring, Use stochastic along with other indicators to avoid false signals.
Click here to download:
Stochastic High-Low Trading Strategy
#3 – Bollinger Band Scalping System
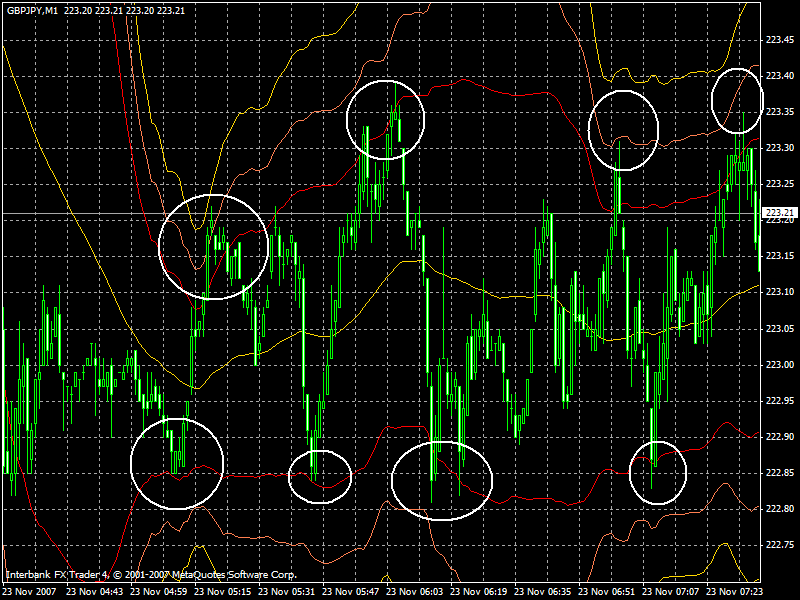
Timeframes for this system is GBPJPY with 1 minute and 5 minute timeframe.
Signals:
Bollinger Wedding band (50) deviation only two shade red-colored;
Bollinger Wedding band (50) deviation 3 shade lime;
Bollinger Wedding band (50) deviation only two shade red-colored.
Quick Accessibility location:
The selling price may retrace to the center of the Bollinger when the selling price last longer than the upper band n at least one half method to your lime n.
Long Accessibility location:
The variation can be that any of the traders may await the value in order to vary involving the decrease red-colored and orange groups. May buy and sell upon retracement to the center.
Exit with 5-10 pips. Income Get out of: Go for 5 in order to 10 pips, or maybe exit with midst group.
Time dependent: If the moment you planned is credited and shuts the purchase then try to figure out how long it acquire the market industry to obtain within the estimated way.
Click here below to download:
Bollinger Band Scalping System
#4 – Neptune Trading System
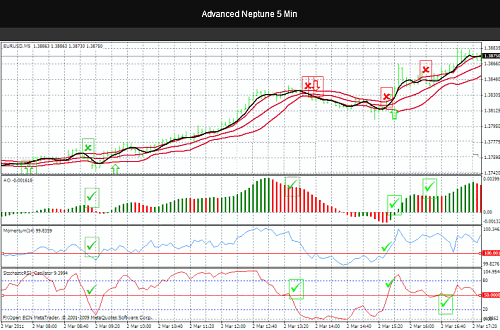
This system is for traders who wants the simple method. It must be use on a busy trading hours of the day which is from 3 am to 11 am EST. This is for trending market, not for congestions. Use major pairs for this technique with 1 minute, 5 min, 14 and 30 minutes.
List of indicators:
EMA period 3
Bollinger band period 20 and standard deviation 3
Chaos Awesome Oscillator
For LONG entry:
EMA period 3 must cross up to the middle band
Chaos (Cao) indicator must be approaching or crossing a zero line.
For SHORT entry:
EMA 3 must cross down to the middle band
Chaos should be approaching or crossing the zero line, going up.
To exit the position, CAO must change color.
Stop Loss must dependent on the cross and the timeframe.
Click here below to download:
#5 – RSI High-Low Strategy
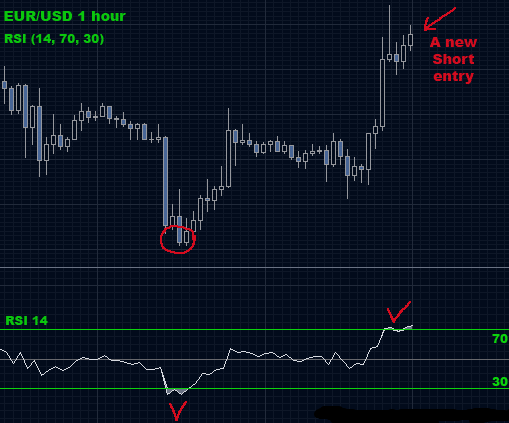
This indicator was commonly used by most traders, you can use any timeframe for this system in all any currency pairs.
List if indicators:
RSI set to 14 with levels 70 and 30
For LONG entry:
Open buy position when RSI cross below 30, formed a bottom and cross back up to 30
For SHORT entry:
Open a sell position when RSI cross above 70, formed a peak and cross back down through 70.
Advantages:
RSI is a good indicator for confirmation for any entry in a simple or complex trading system.
Disadvantages:
Requires more monitoring, false signals may occur.
Click here to download:
#6 – Fast Moving Average Crossover Trading Strategy
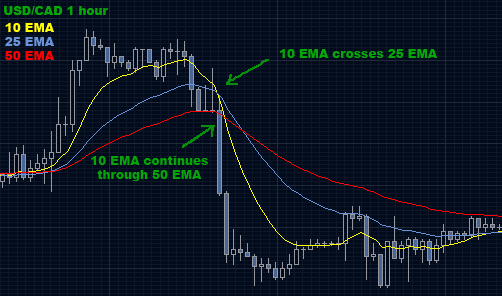
This system can be easy to follow. This works on any currency pairs with 1 hour or 15 minute timeframe.
List of indicators needed:
EMA 10
EMA 25
EMA 50
Entry rules:
When EMA 10 goes through EMA 25, buy or sell in the direction of EMA 10 once it clearly makes it through EMA 50. When 10 EMA goes through 25 EMA. Wait for te current price bar to close in the opposite side of EMA 50.
Exit rules:
There are 2 option for exiting, First is exit when EMA 10 crosses EMA 25. Second is exit when EMA 10 returns and touches EMA 50.
Advantages:
It is easy to use and gives good results when the market is trending, during big price break-outs and big price moves.
Disadvantages:
Fast moving average indicator is a follow-up indicator or it is also called a lagging indicator, which means it does not predict future market directions, but rather reflects current situation on the market. This characteristic makes it vulnerable: firstly, because it can change its signals any time, secondly – because need to watch it all the time; and finally, when market trades sideways (no trend) with very little fluctuation in price it can give many false signals, so it is not suggested to use it during such periods.
Click here to download:
Fast Moving Averages Crossover Trading Strategy
#7 – Trend line Break Out System
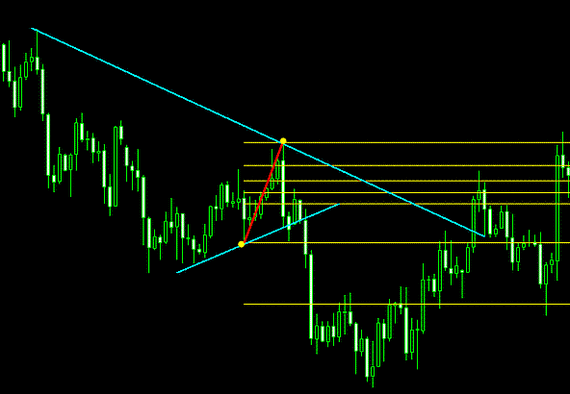
This is trading on breakout systems and will be using more on Fibonacci and trendline. We will be following a trend and not predicting it. Wait for the price to move and confirms signal before entering the market. It represents the direction of the trend.
During an uptrend, the line should be drawn below the price. Connect at least to lowest low. The more lowest the lows and higher highs the trend have, the more powerful it becomes.
During a downdtrend, the line must be drawn below the price Connect at least 2 lower highs. The more the highs and lower the lows the trend makes, the more it is powerful.
Main trends and small trends are to be used in this system. The main trend line must represent main direction of the price. The smaller trend line must represent the minor, inner trend, going the opposite direction of the main trend. Inner trend means a smaller trend within the main big trend
For Long Entry:
Main Trend is Up
Inner Trend is Down
Breakout in the direction of the main trend
Attach Fibonacci levels to the last wave, 0 level on the low and level 100 on the high.
Entry level = Fibonacci level 100
Stop loss level = Fibonacci level 0
Targets = Fibonacci levels 161 – 261 and 423
For Short Entry:
Main Trend is Down
Inner Trend is Up
Breakout in the direction of the main trend
Attach Fibonacci levels to the last wave, 0 level on the high and level 100 on the low.
Entry level = Fibonacci level 100
Stop loss level = Fibonacci level 0
Targets = Fibonacci levels 161 – 261 and 423
Click here below to download: