


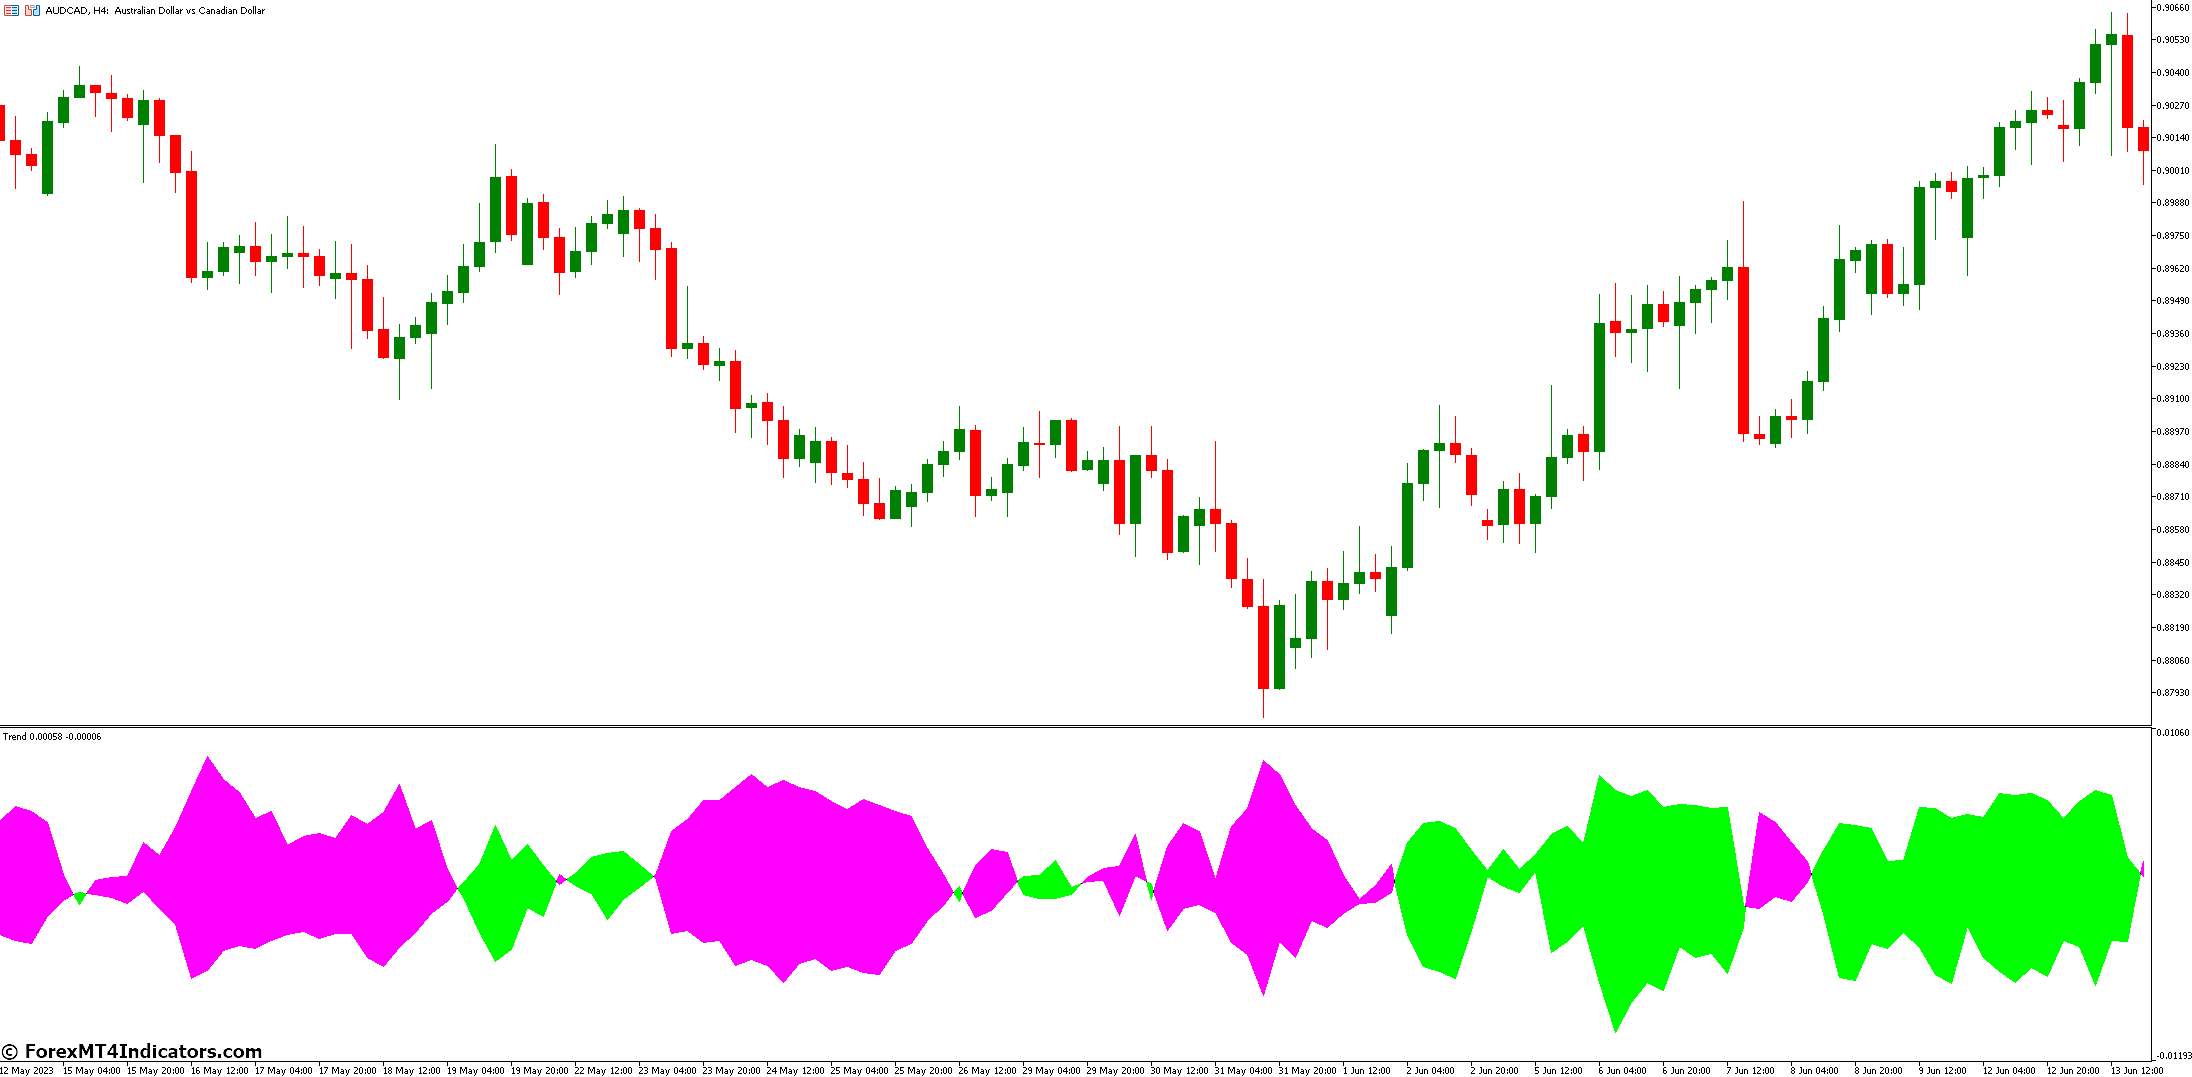
Trend Envelopes Indicator relies on moving averages (MAs) to construct its upper and lower bands. These MAs serve as the foundation, capturing the underlying trend’s essence. By calculating the average price over a specified period, we create a smooth line that filters out noise.
Shifting MAs: Upward and Downward
The magic lies in shifting these MAs. The upper band represents the bullish threshold, while the lower band signifies the bearish threshold. As prices fluctuate, the bands adjust dynamically, providing a visual representation of trend strength and potential reversals.
Determining Optimal Band Margin Shifts
Fine-tuning the band margin shifts (often denoted as K) is crucial. Too wide, and you risk false signals; too narrow, and you miss out on significant moves. Experiment with different values to find the sweet spot for your trading style.
Components Of The Indicator
Upper Band (Bullish Threshold)
The upper band acts as a beacon for potential bullish trends. When prices approach or breach this level, it signals strength and upward momentum. Traders often look for buying opportunities when the price hugs the upper band.
Lower Band (Bearish Threshold)
Conversely, the lower band warns of bearish pressure. A touch or penetration of this level suggests weakness and a possible downtrend. Savvy traders keep an eye on the lower band for selling opportunities.
Simple Moving Average (SMA)
The SMA, at the core of the Trend Envelopes, smooths price data. It’s the building block for calculating the bands. Adjust the SMA period (often denoted as N) to suit your trading horizon.
Market Volatility Considerations
Impact of Volatility on Band Shifting
Volatility affects the indicator’s responsiveness. During high volatility, bands widen, capturing broader price swings. In calmer markets, they narrow.
Adjusting Parameters for Different Market Conditions
Adaptability is key. Customize the indicator based on prevailing market conditions. A volatile currency pair may require wider bands, while a stable stock index benefits from narrower ones.
Practical Application
Identifying Trend Reversals
Combine the Trend Envelopes with other tools like candlestick patterns or RSI to confirm trend reversals. When the price pierces the upper or lower band alongside other signals, pay attention.
Confirmation with Other Indicators
Don’t rely solely on the Trend Envelopes. Use them in conjunction with other technical indicators for robust analysis.
Backtesting Strategies
Test the indicator across historical data. Does it align with your trading philosophy? Backtesting provides valuable insights.
Case Studies
GBP/JPY Swing Trade
- The price touched the lower band, indicating potential buying opportunities.
- Combined with bullish candlestick patterns, the trade yielded profits.
Gold (XAU/USD) Reversal Trade
- The upper band acted as resistance during a strong uptrend.
- When the price broke below the lower band, it signaled a reversal. Short positions were profitable.
Learning from Failures
EUR/AUD Choppy Market
- Whipsaws occurred as the price oscillated around the bands.
- Lesson: Avoid trading when the market lacks direction.
How to Trade with Trend Envelopes Indicator
Buy Entry
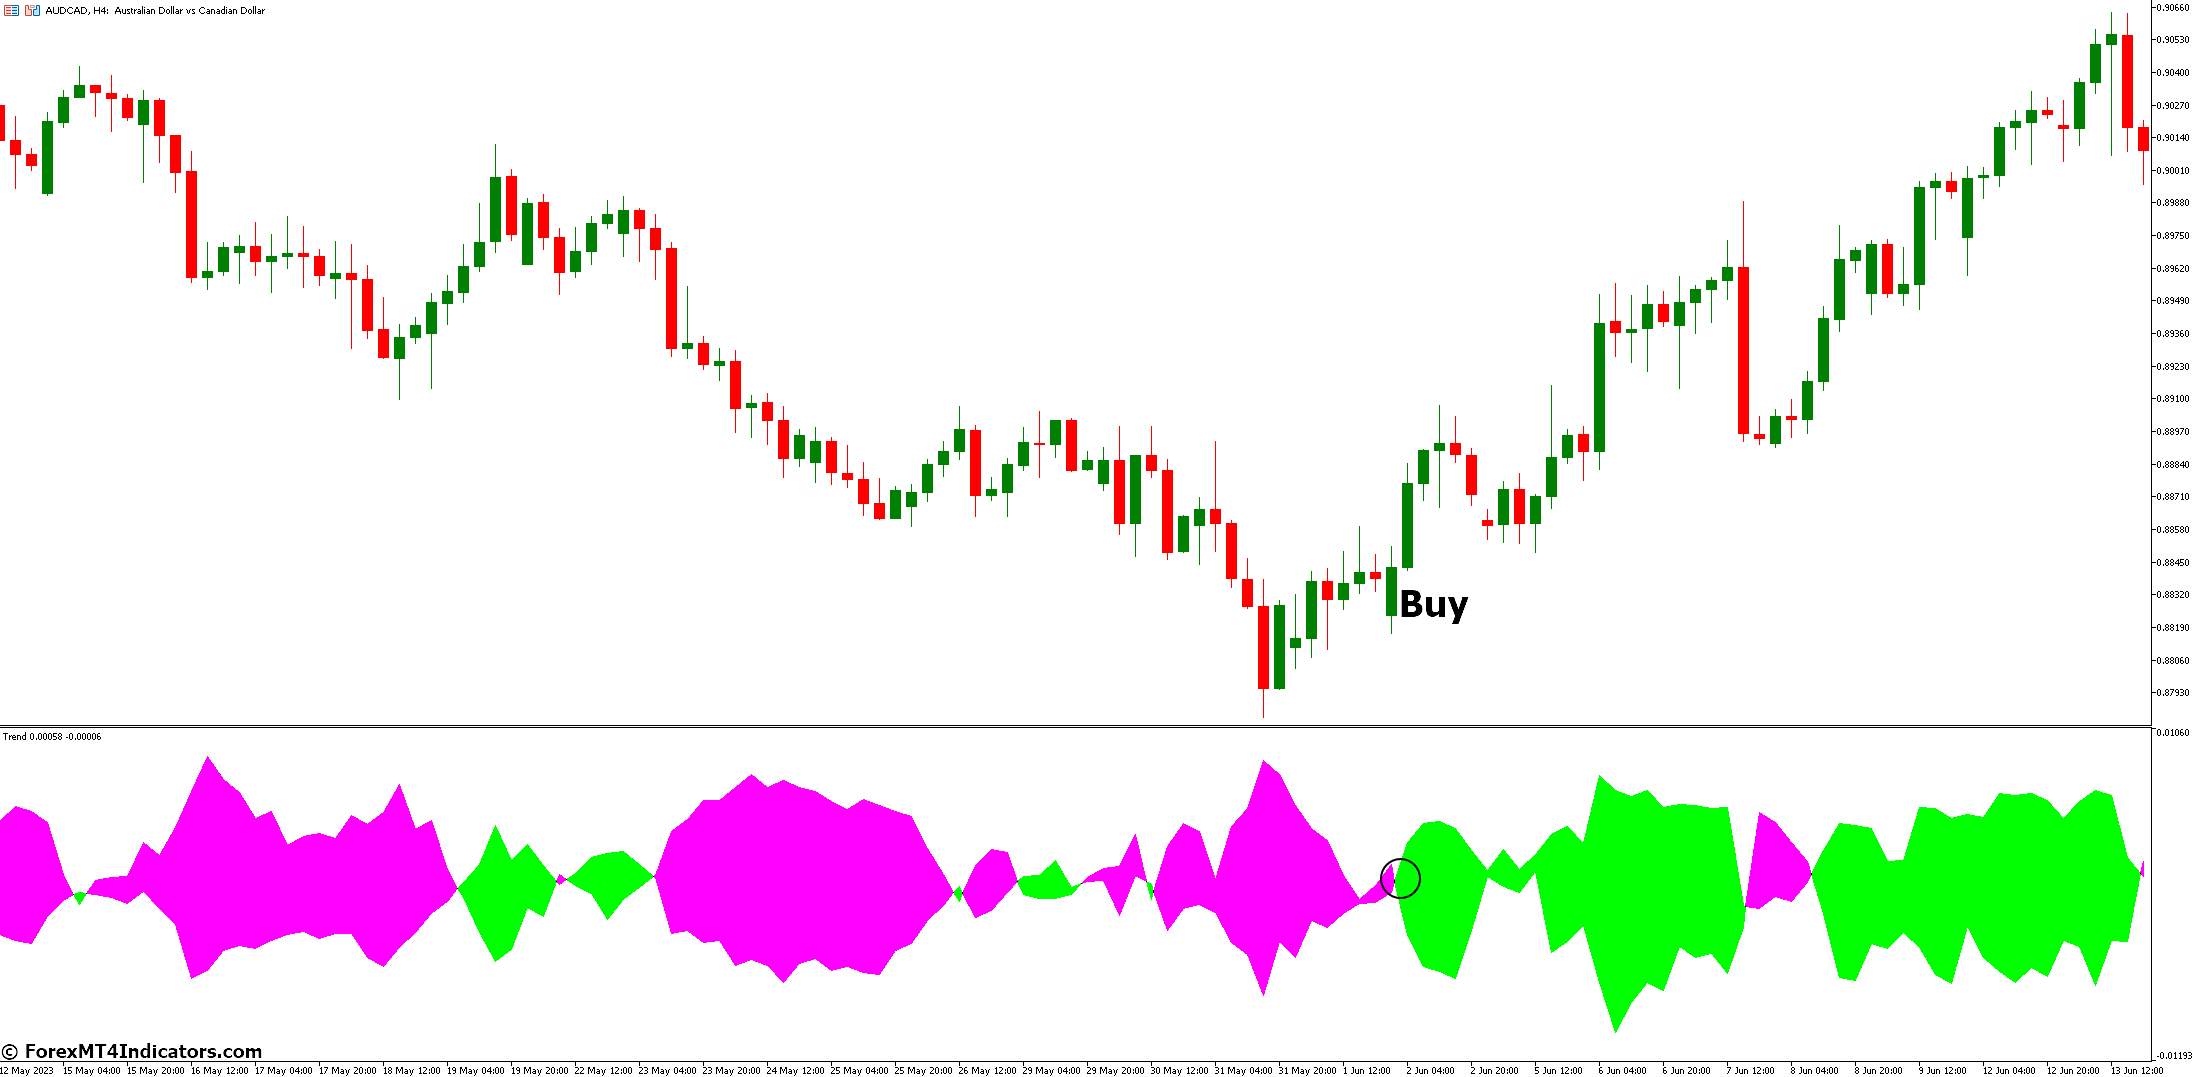
- Wait for the price to reach or touch the lower margin of the Trend Envelopes band.
- Confirm this with other indicators (e.g., RSI, MACD) or candlestick patterns.
- Once the price touches the lower band, consider it a potential buying opportunity.
- Enter a long position when the price starts moving upward from the lower band.
- Set your stop-loss just below the lower band.
- Aim for a profit target based on your risk-reward ratio.
- Consider taking profits when the price approaches the upper band or shows signs of exhaustion.
Sell Entry

- Wait for the price to reach or touch the upper margin of the Trend Envelopes band.
- Confirm this with other indicators or bearish candlestick patterns.
- Once the price touches the upper band, consider it a potential selling opportunity.
- Enter a short position when the price starts moving downward from the upper band.
- Set your stop-loss just above the upper band.
- Determine a profit target based on your risk tolerance.
- Consider taking profits when the price approaches the lower band or shows signs of weakness.
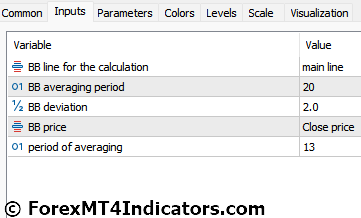
Trend Envelopes Indicator Settings
Conclusion
Trend Envelopes Indicator empowers traders to navigate the markets with precision. Remember, it’s not a crystal ball, but a valuable ally. Combine it with your expertise, risk management, and patience.
Recommended MT5 Brokers
XM Broker
- Free $50 To Start Trading Instantly! (Withdraw-able Profit)
- Deposit Bonus up to $5,000
- Unlimited Loyalty Program
- Award Winning Forex Broker
- Additional Exclusive Bonuses Throughout The Year

>> Sign Up for XM Broker Account here <<
FBS Broker
- Trade 100 Bonus: Free $100 to kickstart your trading journey!
- 100% Deposit Bonus: Double your deposit up to $10,000 and trade with enhanced capital.
- Leverage up to 1:3000: Maximizing potential profits with one of the highest leverage options available.
- ‘Best Customer Service Broker Asia’ Award: Recognized excellence in customer support and service.
- Seasonal Promotions: Enjoy a variety of exclusive bonuses and promotional offers all year round.

>> Sign Up for FBS Broker Account here <<

(Free MT5 Indicators Download)
Click here below to download: