


Trading strategies revolve around three things – momentum, trend and mean reversal.
Advanced traders would often trade based on a confluence of these three factors. Some would combine different indicators to achieve a balance between the three. Others would use multiple timeframes to find confluences. Some would disregard one factor, while others would focus on only one of the three.
However, there are certain indicators that have managed to combine all three into one technical indicator. This provides traders a more complete perspective of what the market is doing even on a single chart.
Momentum pertains to a rapid movement of price in one direction. It refers to the distance traveled by price over a very short period. Trend on the other hand, refers to the directionality of price. This refers to the tendency of price to move in one direction over a longer period. Mean reversal refers to the tendency of price to revert to its average price. All these factors could be structured into individual strategies. However, combining all three together increases the probability of a profitable trade.
Traders Dynamic Index
Traders Dynamic Index (TDI) is a unique indicator because it combines all three factors into one indicator.
The TDI has some similarities with the Relative Strength Index (RSI) indicator. Its main line is in fact an RSI line. It is then followed by a signal line which is a moving average line derived from the RSI line.
The original TDI indicator also has volatility bands. The volatility bands have some similarities with the Bollinger Bands, only that it is based on the movement of the RSI line. It has a midline and outer bands that move along with the RSI line.
All these lines move within a range between 0 to 100. An RSI line that falls below 32 is indicative of an oversold condition, while a line that goes over 68 is indicative of an overbought condition.
The outer lines of the volatility bands could also act as a marker for overbought and oversold conditions.
Trend is based on the crossing over of the RSI line and the signal line.
Trading Strategy
Traders Dynamic Index Forex Trading Strategy is based purely on the Traders Dynamic Index and is used by a group of traders profitably.
There are various setups and ways to trade using the TDI indicator. Some would use the whole set of lines to filter out all low probability trade setups. Others would use only the RSI line and the signal line to allow for more trades but subjectively decide on whether to take a trade or not based on price action. Some would combine the TDI with another oscillating indicator such as the Stochastic Oscillator.
This strategy uses the second option, which is to identify trades based on the RSI line and the signal line, then decide based on price action.
Trades are considered only when the lines cross over coming from the area of an overbought or oversold condition. This makes the entries a mean reversal trade confirmed by the crossover of the two lines.
Indicators:
- TDI Red Green (default setup)
Preferred Time Frames: 15-minute, 30-minute, 1-hour and 4-hour charts
Currency Pairs: major and minor pairs
Trading Sessions: Tokyo, London and New York sessions
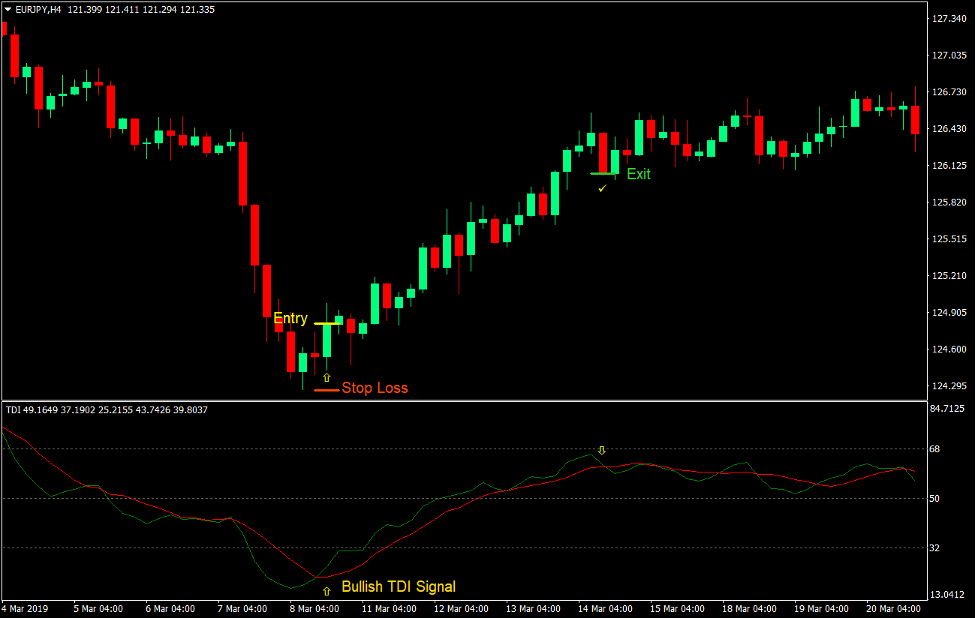
Buy Trade Setup
Entry
- The RSI line and the signal line of the TDI indicator should touch the area below 32.
- The RSI line should cross above the TDI line.
- A bullish momentum candle should be observable.
- Enter a buy order on the confirmation of these conditions.
Stop Loss
- Set the stop loss on the fractal below the entry candle.
Exit
- Close the trade as soon as the signal line crosses below the TDI line.
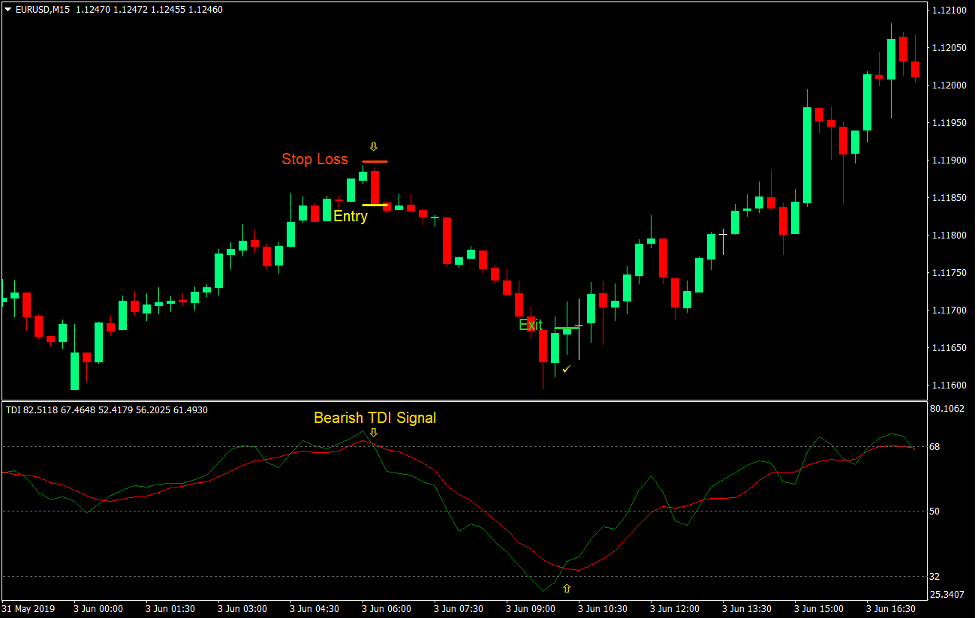
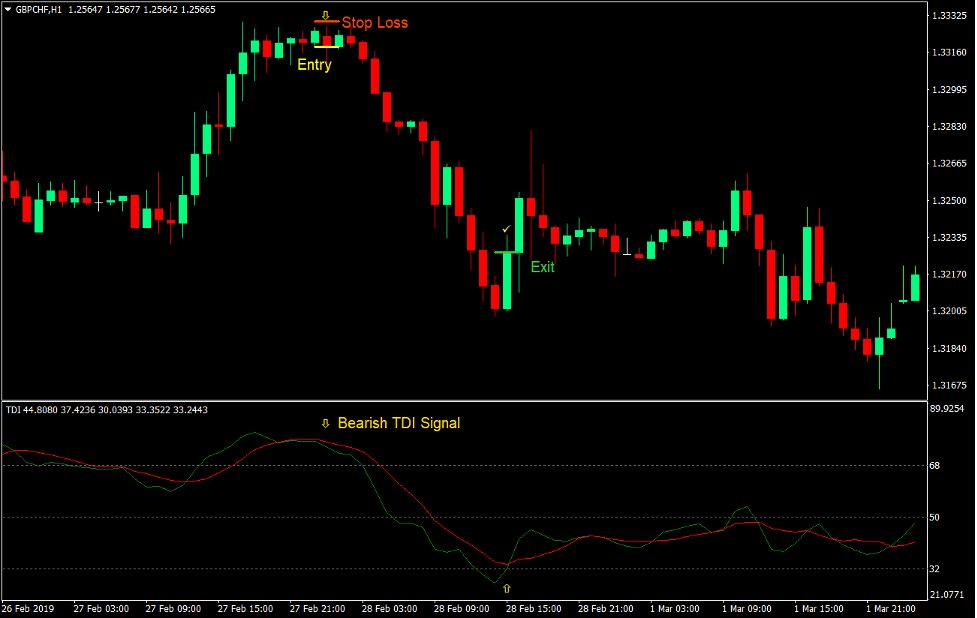
Sell Trade Setup
Entry
- The RSI line and the signal line of the TDI indicator should touch the area above 68.
- The RSI line should cross below the TDI line.
- A bearish momentum candle should be observable.
- Enter a sell order on the confirmation of these conditions.
Stop Loss
- Set the stop loss on the fractal above the entry candle.
Exit
- Close the trade as soon as the signal line crosses above the TDI line.
Conclusion
This strategy is a working strategy used by profitable traders. However, it is not that easy to use.
The line does repaint so trade decisions made prior to the close of the candle should be avoided. Making rash decisions prior to the actual close of the candle often leads to a false signal causing traders to be trapped in a wrong trade.
Traders should also learn about price action as this is very important with this strategy. It may cause trade decisions to be subjective, but traders who master this are very profitable.
Recommended MT4 Brokers
XM Broker
- Free $50 To Start Trading Instantly! (Withdraw-able Profit)
- Deposit Bonus up to $5,000
- Unlimited Loyalty Program
- Award Winning Forex Broker
- Additional Exclusive Bonuses Throughout The Year

>> Sign Up for XM Broker Account here <<
FBS Broker
- Trade 100 Bonus: Free $100 to kickstart your trading journey!
- 100% Deposit Bonus: Double your deposit up to $10,000 and trade with enhanced capital.
- Leverage up to 1:3000: Maximizing potential profits with one of the highest leverage options available.
- ‘Best Customer Service Broker Asia’ Award: Recognized excellence in customer support and service.
- Seasonal Promotions: Enjoy a variety of exclusive bonuses and promotional offers all year round.

>> Sign Up for FBS Broker Account here <<
Click here below to download: