


The forex market is probably one of the most chaotic looking markets in trading. Whenever you would open up a naked chart, you would usually find a market that has price going all over. This is probably one of the reasons why forex trading seems to be one of the most difficult markets to trade at. However, there are ways to make sense of this chaotic market, a way to tame the noise of price going all over the place. This is by the use of indicators. Some naked chart price action purists would often say that indicators is a source of noise, however, with the right kinds of indicators working together, you would see how a chart would make more sense. You would see how clear the trend direction is in relation to the indicator.
The SAR Oscillator
The Parabolic Time/Price System, otherwise known as “Stop and Reverse” (SAR), was developed by Welles Wilder and introduced in 1978, in his book New Concepts in Technical Trading Systems. Although this indicator seems to be very old, but it is one of those classic indicators that have stood the test of time.
The mathematical concept behind the SAR is quite complex because it makes use of if-then formulas depending on whether the SAR is indicating an uptrend or a downtrend. It is one that makes use of the extreme points in price, which are the highest highs and lowest lows. With the classic SAR indicator, the information derived from the SAR is then plotted as a dot on the price chart. These dots are usually used for trailing stop losses since in theory, price should not touch the SAR dots when the market is trending.
With the SAR Oscillator however, instead of plotting dots on the price chart, histogram bars are plotted on a separate window. Positive histograms are considered bullish while negative histograms are considered bearish. If you would look at a price chart and compare it with the SAR Oscillator, you would notice how clearly it follows the trend.
The HAMA Indicator
The HAMA indicator is a custom trend indicator which works well in determining established trends. If you would look at it closely, it somehow resembles a Heiken Ashi Smoothed indicator, which is basically a modified Heiken Ashi (HA) derived from moving averages (MA). The type of moving average used is typically an Exponential Moving Average (EMA).
Although it is unclear what the mathematical formula behind the HAMA custom indictor is, this indicator is one of those that works well as a trend following indicator. Some traders interpret it as a trend indicator and trades it as they would trade a crossover strategy. Whenever the HAMA indicator changes color, traders would then take the trade in the direction of the trend. Some would trade retraces on the HAMA indicator expecting a bounce off it.
Trading Strategy Concept
The SAR Oscillator and the HAMA custom indicators are trend following indicators that seem to work well in identifying established trends. If you would look at them closely, on a clearly trending market, price would rarely spike through the trends these indicators show.
These indicators also work well as complimentary indicators. The entry signals these indicators generate occur close to each other. The SAR Oscillator seems to respond quicker while the HAMA indicator seems to reverse less often. However, whenever these indicators agree with each other, the market seems to trend strongly allowing price to move far in one direction for quite some time. These converging reversal points based on a bigger picture trend will be the focal point of our trading strategy.
Before we go into the actual entry signals based on the two indicators, we will be making use of a long-term trend filter based on the 200-period Exponential Moving Average (EMA). Only trade setups that agree with the trend indicated by the 200 EMA will be acted upon. Whenever price and the HAMA is above the 200 EMA, the market will be considered bullish. On the other hand, the market will be considered bearish if price and the HAMA is below the 200 EMA.
Then, we will be looking for entry signals generated by the HAMA and the SAR Oscillator that are in confluence with each other and takes place close to each other, with deviations of within two to three periods. These will be our entry signals.
We will then hold the trade until the SAR Oscillator shows signs of possible trend reversals, since the SAR Oscillator would typically generate signals prior to the HAMA indicator.
Indicators
- HAMA_
- SAR_oscillator
- pass: 0.06
- max: 0.1
- 200 EMA (gold)
Timeframe: preferrably 1-hour and 4-hour charts
Currency Pair: major and minor pairs
Trading Session: Tokyo, London and New York sessions
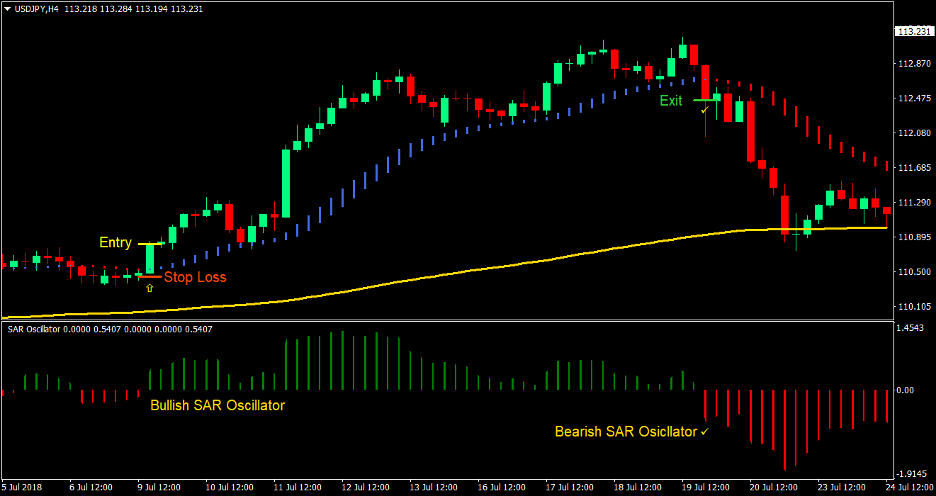
Buy (Long) Trade Setup
Entry
- Price should be above the 200 EMA
- The HAMA should be above the 200 EMA
- Wait for price to retrace causing a temporary bearish condition on the HAMA and SAR Oscillator
- Wait for the SAR Oscillator to print positive histograms indicating the resumption of the bullish market condition
- Enter a buy order as soon as the HAMA indicator changes to royal blue confirming the resumption of the bullish trend
Stop Loss
- Set the stop loss below the HAMA indicator
Exit
- Close the trade as soon as the SAR oscillator prints a negative histogram indicating the possible end of the bullish trend
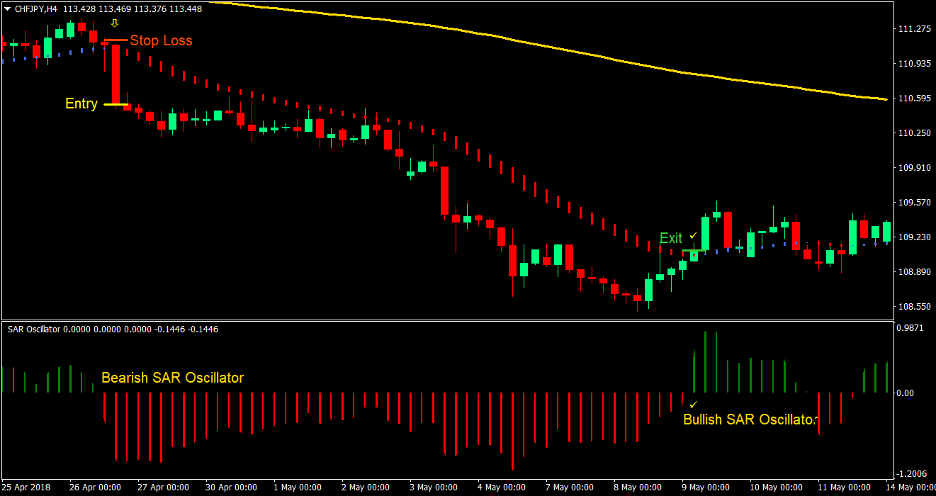
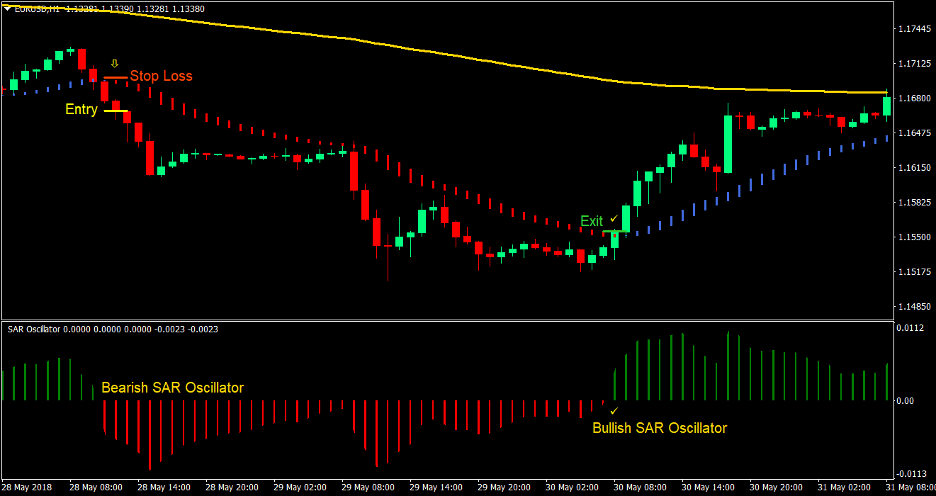
Sell (Short) Trade Setup
Entry
- Price should be below the 200 EMA
- The HAMA should be below the 200 EMA
- Wait for price to retrace causing a temporary bullish condition on the HAMA and SAR Oscillator
- Wait for the SAR Oscillator to print negative histograms indicating the resumption of the bearish market condition
- Enter a sell order as soon as the HAMA indicator changes to red confirming the resumption of the bearish trend
Stop Loss
- Set the stop loss above the HAMA indicator
Exit
- Close the trade as soon as the SAR oscillator prints a positive histogram indicating the possible end of the bearish trend
Conclusion
This strategy is a high probability, high return trading strategy. This is because both the intermediate trend, represented by the HAMA and SAR Oscillator, and the long-term trend, represented by the 200 EMA, are aligned. This would often result to trades that yield a 2:1 reward-risk ratio.
There will be some instances wherein a trade setup would result to a loss. This could be due to a stop loss being prematurely hit. You may opt to have a mental stop loss to avoid this situation. However, you would need strict discipline whenever price reverses on the trade.
Other instances of losses could be due to an actual reversal of trend after the entry. This typically occurs on an overextended trend. Avoid taking trades which seem to be on an overextended trend.
All in all, this strategy should yield some profits if implemented with proper risk management.
Recommended MT4 Brokers
XM Broker
- Free $50 To Start Trading Instantly! (Withdraw-able Profit)
- Deposit Bonus up to $5,000
- Unlimited Loyalty Program
- Award Winning Forex Broker
- Additional Exclusive Bonuses Throughout The Year

>> Sign Up for XM Broker Account here <<
FBS Broker
- Trade 100 Bonus: Free $100 to kickstart your trading journey!
- 100% Deposit Bonus: Double your deposit up to $10,000 and trade with enhanced capital.
- Leverage up to 1:3000: Maximizing potential profits with one of the highest leverage options available.
- ‘Best Customer Service Broker Asia’ Award: Recognized excellence in customer support and service.
- Seasonal Promotions: Enjoy a variety of exclusive bonuses and promotional offers all year round.

>> Sign Up for FBS Broker Account here <<
Click here below to download: