


Random walk theory states that price changes are independent of each other. This implies that historical prices cannot be used to predict future price movements. In a way, proponents of the random walk theory believe that price movements are random and therefore cannot be predicted.
For the most part, this holds a kernel of truth in it. The market does seem to be chaotic most of the time. Price could fluctuate randomly across the chart. No patterns are visible, trendlines are nowhere to be seen. It just seems that price oscillates randomly without any sense of direction. It is somehow like a drunk person taking a random walk whose steps you cannot predict. This is the case whenever the market is either ranging or is in a choppy price movement.
Sadly, the market does this for about 80% of the time. However, for that remaining 20%, the market trends in one direction. In this small window, the market presents a bit more clarity. It moves in one direction which could easily be deciphered by traders. Trendlines could be drawn. Market swings are either making new highs in a bullish trend or new lows in a bearish trend.
During this window, trade direction is easier to predict. The question of which direction to take becomes easy. The only dilemma left to tackle would be how to time the market entry.
Moving Average RSO Trend Forex Trading Strategy is a strategy that aids traders in identifying and confirming a trending market condition as well as providing specific trade entries that would allow a high probability trade entry.
Relative Strength Oscillator (RSO)
Relative Strength Oscillator (RSO) is a technical indicator which helps detect trend, momentum and overbought and oversold market conditions.
The RSO is a modified version of the Relative Strength Index (RSI). It is also displayed as an oscillator with histogram bars connected by a line. The bars change color depending on the direction of the RSO line. An RSO line that is angled up would be printing a lime bar, while an RSO line that is angled down would print a red bar.
The RSO line oscillates around its midline at zero. It has markers for overbought and oversold conditions at +20 and -20. Extreme overbought and oversold conditions are marked at +50 and -50.
Trend direction is indicated by whether the bars are positive or negative. Positive bars indicate a bullish bias, while negative bars indicate a bearish bias. A trending market would be observed whenever the bars would stay positive in a bullish trend or negative in a bearish trend.
MA in Color
The moving average line is probably the most popular way to identify trend direction. One of the ways to identify trend direction using the moving average line is through its slope. A moving average line that is sloping up is indicative of a bullish trend while a moving average line that is sloping down is indicative of a bearish trend. The steeper the slope, the stronger the trend.
MA in Color is a trend and momentum indicator based on the moving average line. It is a moving average line that changes color whenever it detects a trend.
In this setup, the line is yellow whenever it is not yet detecting a trend. It then changes to blue whenever it detects a probable bullish trend, or red whenever it detects a probable bearish trend.
Trading Strategy
This strategy is a trend following strategy based on the two indicators above.
A 50-period Exponential Moving Average (EMA) line is used to identify trend direction. Trends will be based on the slope of the line, as well as the location of price in relation to the 50 EMA line. The trend is also confirmed by the location of the MA in Color line in relation to the 50 EMA line. Trades are then filtered based on trend direction.
The RSO indicator would also be used to confirm trend direction. In a trending market, bars on the RSO line would be consistently staying either above zero in a bullish trend, or below zero in a bearish trend.
Traders should also be observing if the market is constantly making new highs in a bullish trend, or new lows in a bearish trend. This would be a better confirmation of a trend and would warrant the use of this strategy.
If all these conditions to qualify a trend are confirmed, then we would be waiting for a retracement. This would be indicated by a temporary change in color of the MA in Color line. A trade is taken as soon as the line resumes the color of the current trend.
Indicators:
- 50 EMA (orange)
- MA_in_Color
- MAPeriod: 10
- RSO (default setting)
Preferred Time Frames: 15-minute, 30-minute, 1-hour and 4-hour charts
Currency Pairs: major and minor pairs
Trading Session: Tokyo, London and New York sessions
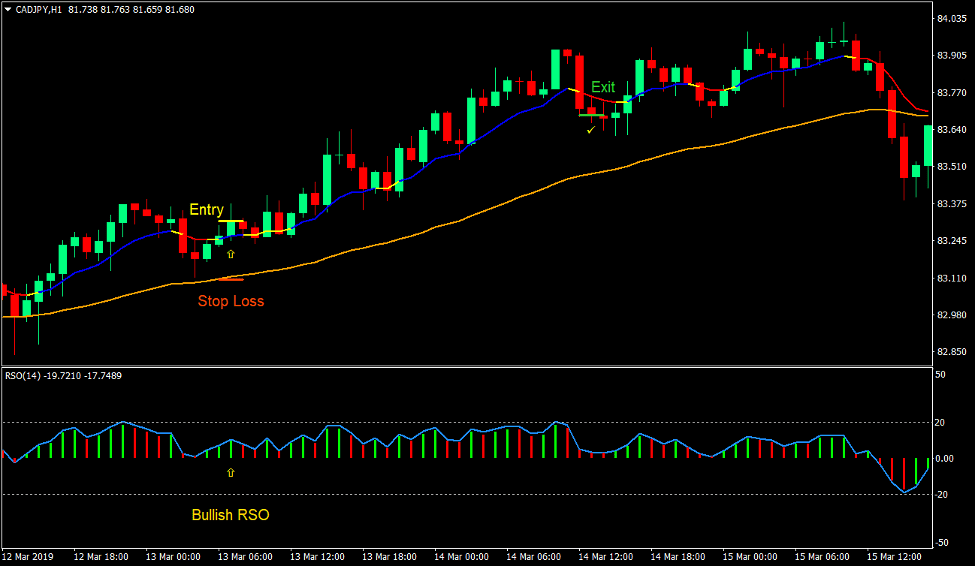
Buy Trade Setup
Entry
- Price should be above the 50 EMA line.
- The MA in Color line should be above the 50 EMA line.
- The 50 EMA line should be sloping up.
- The RSO line should be printing positive bars.
- Wait for a retracement to occur causing the MA in Color line to temporarily change to red.
- Enter a buy trade as soon as the MA in color line changes to blue.
Stop Loss
- Set the stop loss on the fractal below the entry candle.
Exit
- Close the trade as soon as the MA in color line changes to red.
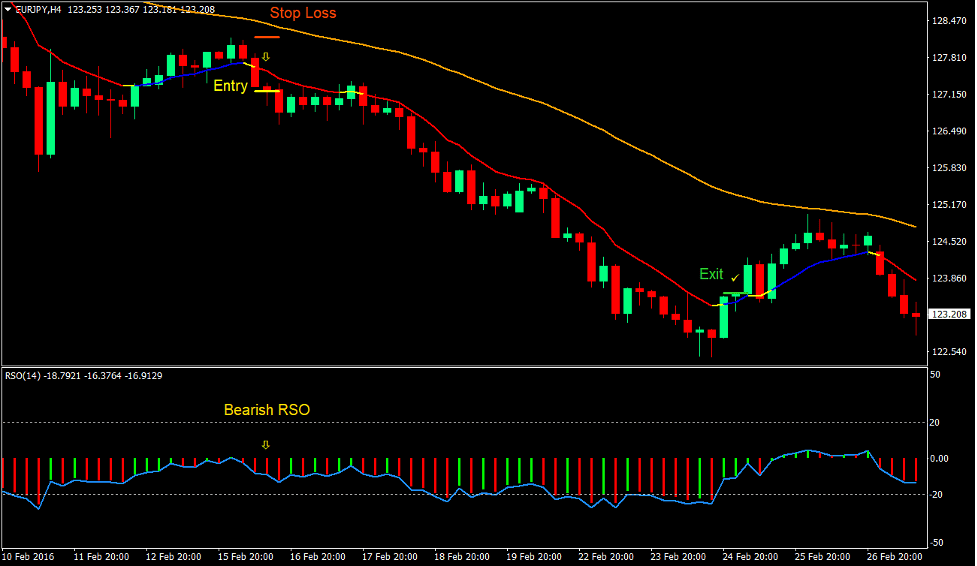
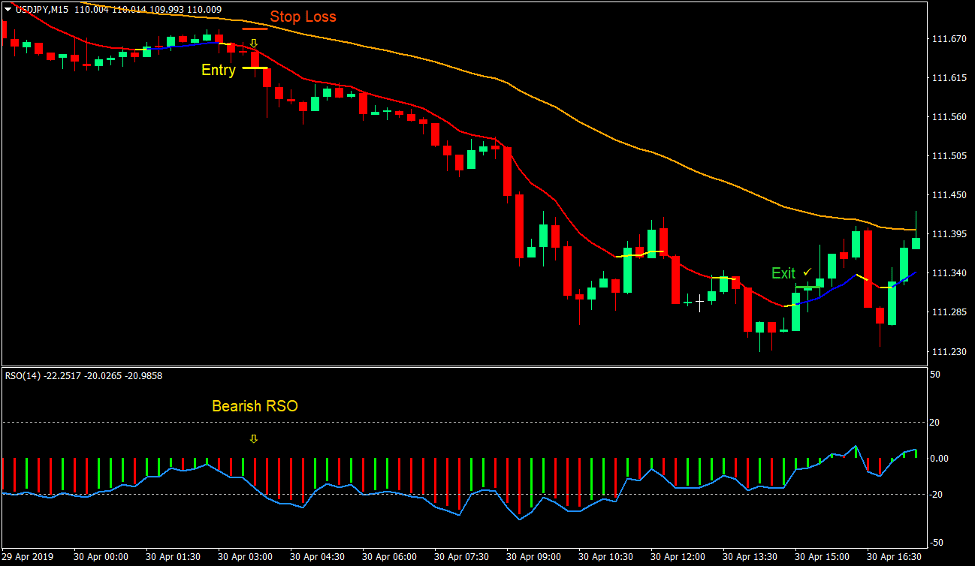
Sell Trade Setup
Entry
- Price should be below the 50 EMA line.
- The MA in Color line should be below the 50 EMA line.
- The 50 EMA line should be sloping down.
- The RSO line should be printing negative bars.
- Wait for a retracement to occur causing the MA in Color line to temporarily change to blue.
- Enter a sell trade as soon as the MA in color line changes to red.
Stop Loss
- Set the stop loss on the fractal above the entry candle.
Exit
- Close the trade as soon as the MA in color line changes to blue.
Conclusion
Trading with the trend is a good way to trade the market. However, you would still need a strategy to trade in a trending market. This is a viable way to trade trends profitably.
Traders who could correctly identify the trend, observe price action and candlestick patterns on retracements, and enter the market correctly with the confirmation of the rules in this strategy could profit from the forex market using this strategy.
Recommended MT4 Brokers
XM Broker
- Free $50 To Start Trading Instantly! (Withdraw-able Profit)
- Deposit Bonus up to $5,000
- Unlimited Loyalty Program
- Award Winning Forex Broker
- Additional Exclusive Bonuses Throughout The Year

>> Sign Up for XM Broker Account here <<
FBS Broker
- Trade 100 Bonus: Free $100 to kickstart your trading journey!
- 100% Deposit Bonus: Double your deposit up to $10,000 and trade with enhanced capital.
- Leverage up to 1:3000: Maximizing potential profits with one of the highest leverage options available.
- ‘Best Customer Service Broker Asia’ Award: Recognized excellence in customer support and service.
- Seasonal Promotions: Enjoy a variety of exclusive bonuses and promotional offers all year round.

>> Sign Up for FBS Broker Account here <<
Click here below to download: