


CCI-EMA Divergence Swing Forex Trading Strategy
In this strategy we will be talking mainly about the Commodity Channel Index (CCI) and how it could be used to trade divergences. We will also be layering this strategy with an Exponential Moving Average to add more accuracy to it.
What is the Commodity Channel Index (CCI)? It is an oscillating indicator introduced by Donald Lambert back in the 1980s.
“Is it just another indicator? What makes it special?”, you may say. Well it could be just another indicator. I used to look at it this way, when I skim through the list of built-in indicators on the MT4. Never have given it much thought. But upon close scrutiny, this oscillating indicator does seem to be very responsive, mirroring the highs and lows of the price action closely. Yes, it may have one or two candles lag sometimes, but it is very usable.
So, I researched what it is about. It turns out that it uses the concept of Typical Price, which is basically the average of the high, low, and close. We will not get into the lengthy discussion of its mathematical formula, we will let the computer do it all for us. But what the CCI really is in my mind is an oscillator representing the average of the average price.
What is it to us if the CCI is an average of the average price? Well, to me any oscillator that talks about average price is something that could be good for divergences.
One advantage of the CCI as an oscillator used for divergences though is that it is not too slow and is leaning towards the faster side of the spectrum, unlike the MACD which is a tad slower than most. It also has these jagged peaks and valleys which makes it easier to pinpoint the exact candle where the peak or valley is. But these strengths could also be a weakness because it might also create some false signals. However, the CCI typically has an overbought and oversold marker, represented by the +/- 100 lines on the indicator. These could help us filter our trades, taking only overbought or oversold entries. Plus, we will be using additional filters to help us have higher quality setups.
Hidden Divergences
During trending markets, the typical divergences that occur are hidden divergences, since these mean reversions are typically trend continuations of a bigger picture trend.
There are two kinds of hidden divergences – a hidden bullish divergence and a hidden bearish divergence.
A bullish hidden divergence has low followed by a higher low on the price chart, while on the CCI indicator window it has a low followed by a lower low. Below is an example of a hidden bullish divergence.
What this chart is telling us is that the price action is on an uptrend printing higher and higher lows. However, the CCI is telling us that it has retraced enough to be considered as oversold and might be a good time to buy. In effect, we are buying the mean reversion of an uptrend, which stacks the odds on our favor. Plus, we are buying off a bounce from the 50 EMA.
On the other hand, a hidden bearish divergence has a high followed by a lower high on the price chart, and a high followed by a higher high on the CCI indicator window.
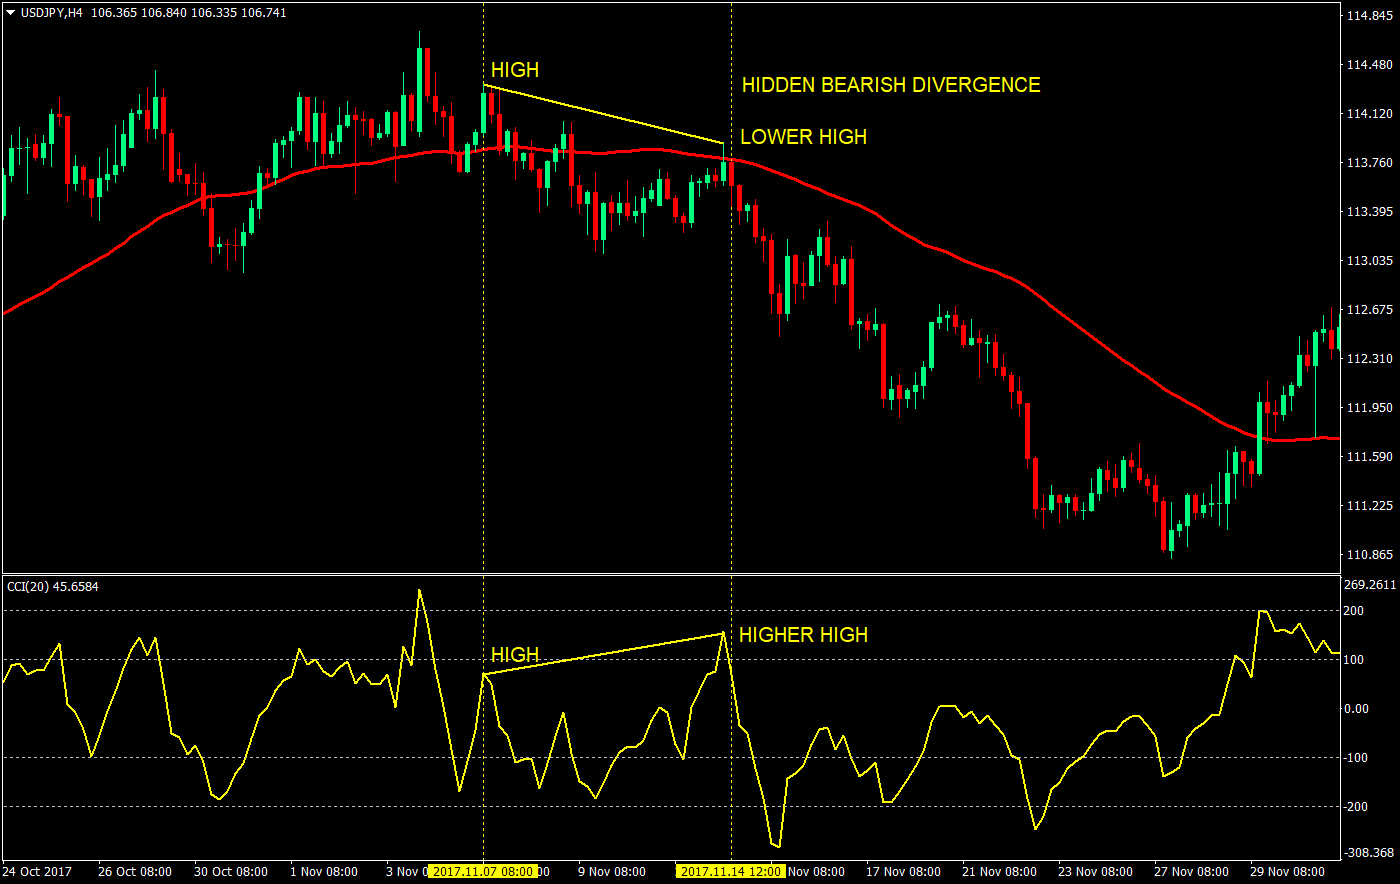
This hidden bearish divergence chart is telling us that price action is on a down trend, printing lower and lower highs. However, the CCI is telling us that price has retraced enough to be considered as an overbought scenario. Again, by selling an overbought scenario on a downtrend, we are stacking the odds on our favor. On top of that, we are also selling off a bounce from the 50 EMA.
The Setup: CCI Divergence Plus 50 EMA Bounce
Although we haven’t discussed it much, you should be guessing that we will be using the 50 EMA to a great extent in this strategy, and you are right. The reason for this is that many traders use the 50 EMA as an indicator of the intermediate trend bias. And if we would try to observe price around it, price do usually respect and bounce off the 50 EMA area.
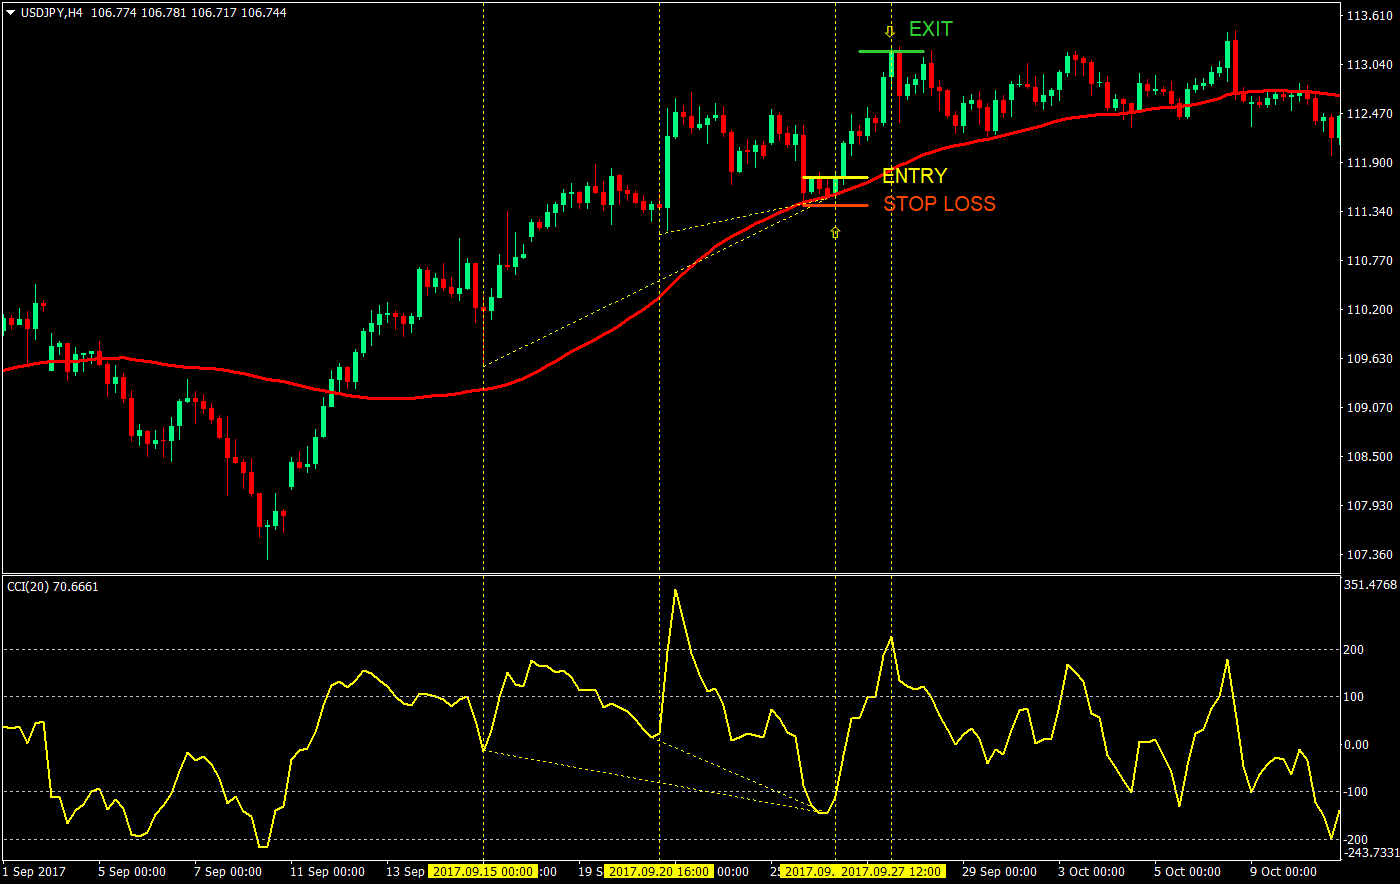
Buy Setup:
- Price should be above the 50 EMA
- The CCI should be below the -100-mark indicating an oversold condition
- An imminent hidden bullish divergence should be present
- Price should bounce off the 50 EMA area
- CCI should turn upwards confirming the new low on the CCI
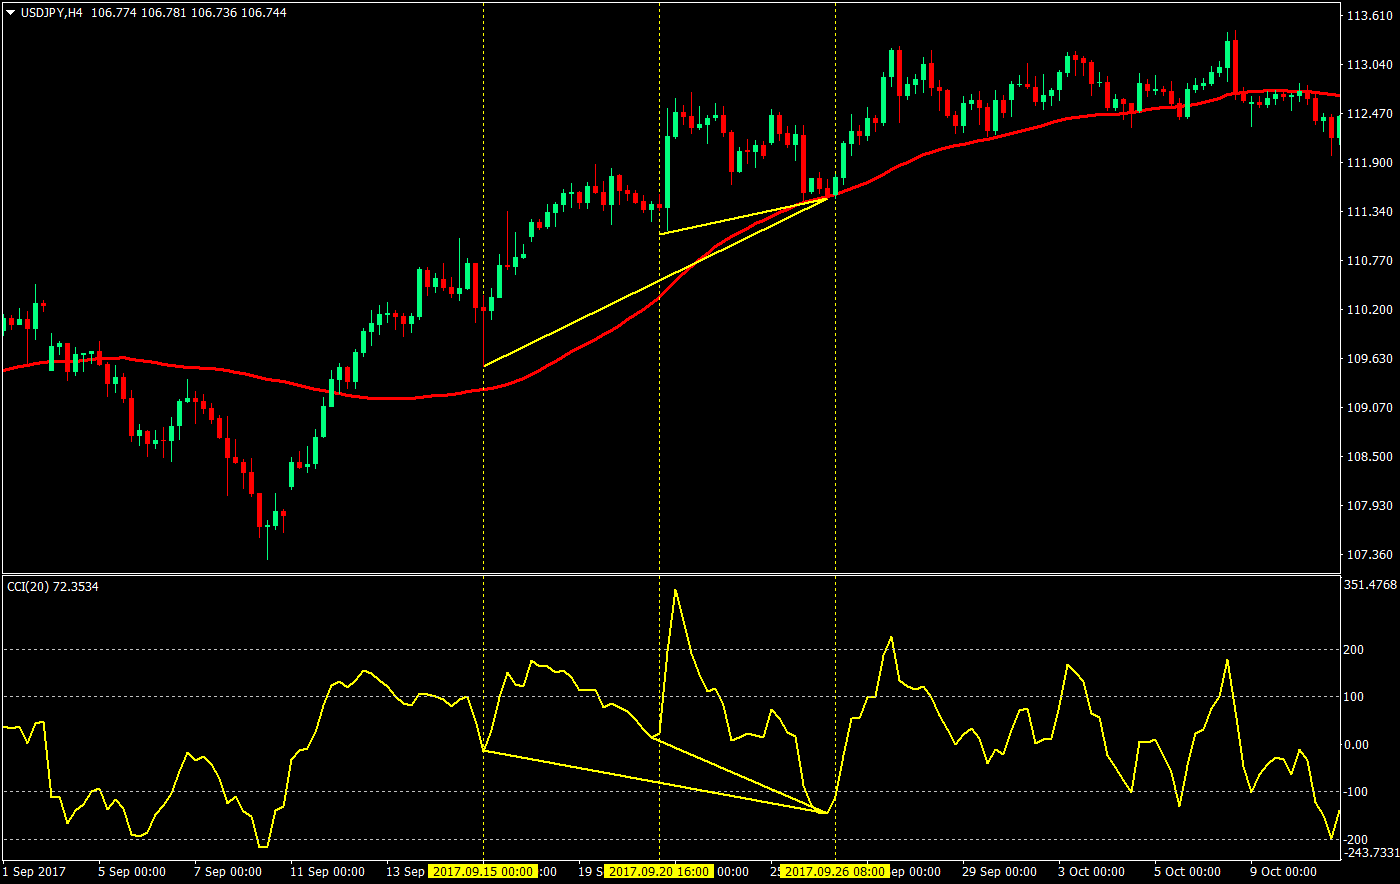
This chart shows a couple of hidden bullish divergences and has all the parameters fulfilled.
Stop Loss: A few pips below the 50 EMA or the fractal formed by the new low
Exit: Close the trade at the close of the candle which coincides with the CCI being above the 200-mark
Sell Setup:
- Price should be below the 50 EMA
- The CCI should be above the 100-mark indicating an overbought condition
- An imminent hidden bearish divergence should be present
- Price should bounce off the 50 EMA area
- CCI should turn downwards confirming the new high on the CCI
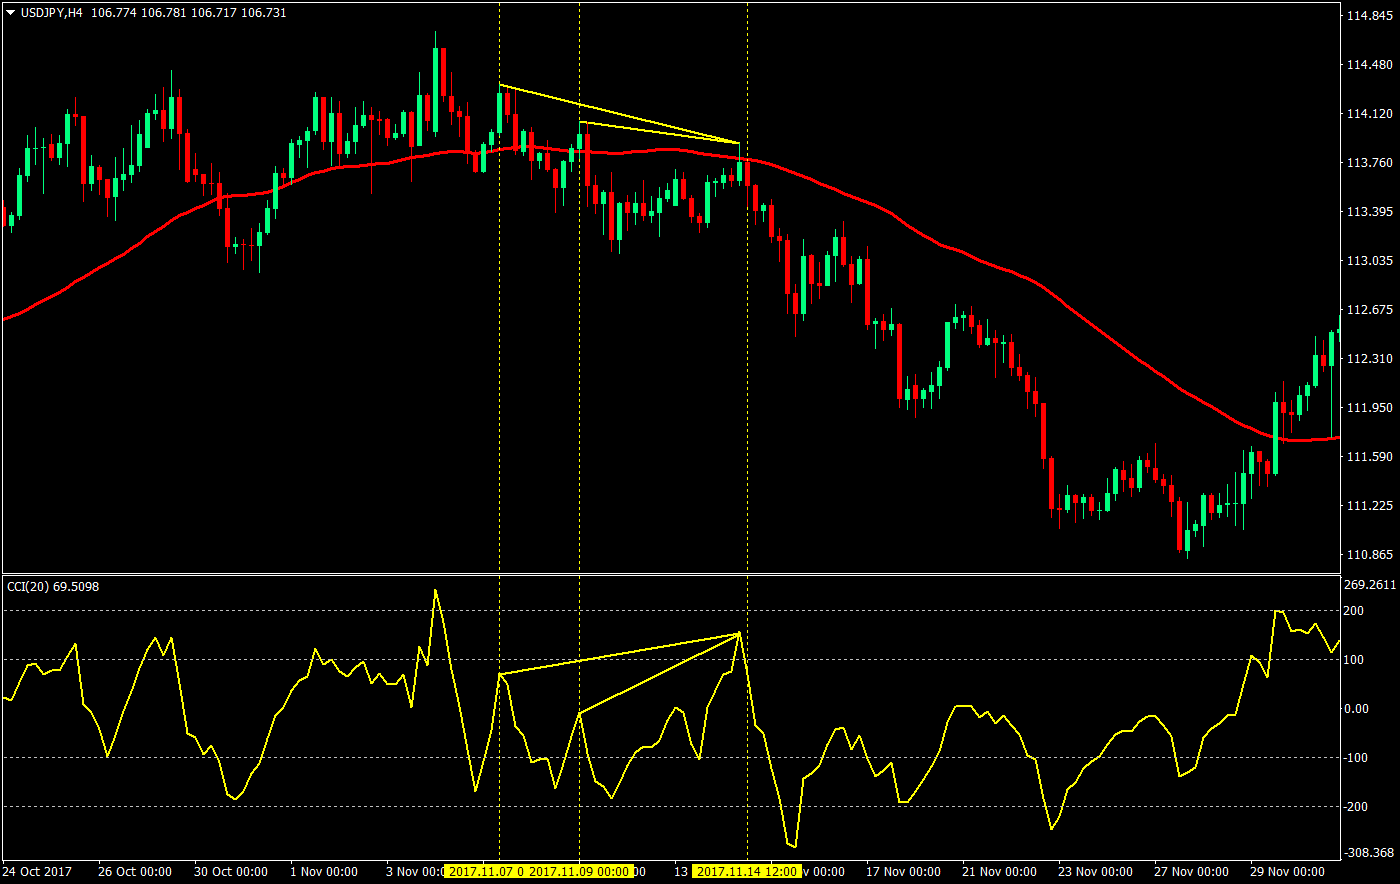
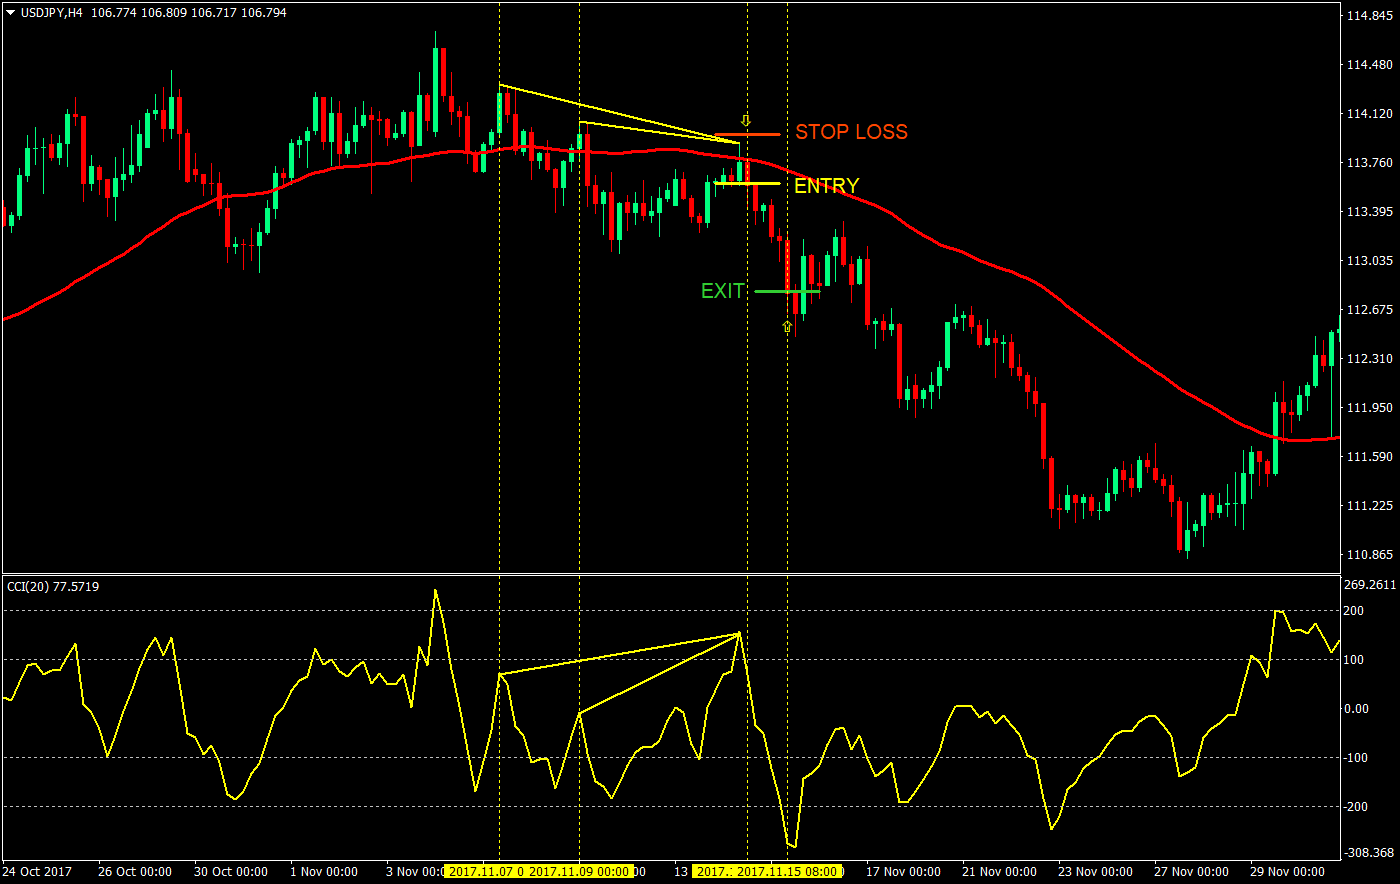
This chart also shows a couple of hidden bearish divergences and all the parameters fulfilled.
Stop Loss: A few pips above the 50 EMA or the fractal formed by the new low
Exit: Close the trade at the close of the candle which coincides with the CCI being below the -200-mark
Conclusion
All these parameters individually could already be an entry setup but putting it all together increases our odd of a successful trade. However, it also reduces the number of trades that we can take. And it also doesn’t mean that all our trades will be profitable. We could win some or lose some. But given that we’ve stacked odds in our favor by incorporating EMA bounces, CCI overbought and oversold conditions, and hidden divergences, the chances of a profitable trade should be greatly increased.
There are some pitfalls though. One glaring probable setup that would result in a loss would be a reversal. It would print overbought or oversold conditions for sure. It could even print divergences. It could also show a possible bounce off the 50 EMA only to continue its reversal course. This is all part of trading. In other cases, price could hit your stop loss prior to going your direction. You could also find cases where the CCI doesn’t quite hit the +/-200-mark for our exit targets.
It would be up to you to tweak the strategy to your liking. Tweak the stop loss, profit targets, scale out maybe. Study and improve it further. Happy trading.
Recommended MT4 Broker
- Free $50 To Start Trading Instantly! (Withdrawable Profit)
- Deposit Bonus up to $5,000
- Unlimited Loyalty Program
- Award Winning Forex Broker
- Additional Exclusive Bonuses Throughout The Year

>> Claim Your $50 Bonus Here <<
Click here below to download: