


Most professional traders think in probabilities. This is because trading is about probabilities. It is about finding a recurring pattern or set of occurrences which would correlate with a result that is favorable to us. It would not always be right, but it should be right more often than not. Nothing is sure in trading. Anything can happen. However, traders who think in terms of probabilities know that if the same action is done again and again whenever the recurring patterns occur, they should come out profitable in the long run.
Trading is all about probabilities and one of the best ways to improve a statistical chance in trading is by looking for confluences. Confluences could come in different forms. It may be by using technical indicators. It could be by aligning a trend reversal signal and momentum. It may be by looking for multiple price action indications. It could also be by aligning timeframes.
One of the best confluences to look for when trading is aligning the long-term trend with a short-term momentum. This significantly stacks the odds in favor of the trade. It allows traders to trade in the direction of the long-term trend while enjoying the momentum push brought about by the shorter-term trend.
Trend Synergy Forex Trading Strategy is a strategy that trades in the direction of the long-term trend while confirming the trend strength of the short-term momentum and trading on the immediate trend reversal in the direction of the long-term trend. It makes use of a few technical indicator that would help traders identify trending markets, trend direction and specific entry points.
MACD Dot
The Moving Average Convergence and Divergence (MACD) is a technical indicator which is widely used by many traders. It was developed to help traders identify changes in the direction, strength, momentum and duration of a market trend.
The classic MACD is an oscillator type of technical indicator. It is computed based on the difference between two moving average lines. Which are the 12-period and 26-period Exponential Moving Averages (EMA). It also plots another line based on a 9-period Exponential Moving Average (EMA) of the prior line. This creates two lines that interact with each other. Other classic MACD indicators would also plot histogram bars indicating the difference between the two lines.
Trends are usually based on how the two lines are positioned. Having the MACD line above the signal line indicates a bullish trend, while having it stacked inversely indicates a bearish trend. This would also coincide with the histogram bars being positive or negative. Trend reversal signals are generated based on the crossing over of the two lines or the shifting of the histogram bars over its midline.
The MACD Dot indicator is a simple indicator which plots dots whenever the two lines intersect. It plots blue dots below price whenever it detects a bullish trend reversal, and red dots above price whenever it detects a bearish trend reversal.
Average Directional Movement Index
The Average Directional Movement Index or ADX is a trend following indicator developed to help traders identify the overall direction of the trend, as well as the strength of the trend.
The ADX is an average expanding price range value. It measures the strength of price movement whether positive or negative by computing these directions separately. It then plots two lines, which are DMI+, which is the positive direction movement, and DMI-, which is the negative directional movement. Having the DMI+ line above the DMI- line indicates a bullish trend direction. Inversely, having the DMI+ below the DMI- line indicates a bearish trend direction.
The ADX also plots another line which indicates the strength of the trend. This line is called the ADX. An ADX line which is above 25 indicates a trending market condition, while an ADX line which is below 25 indicates a non-trending market. An ADX line which is curling up would also indicate that the market is picking up on its trending momentum.
Trading Strategy
This trading strategy is a trend following strategy which aligns the long-term and short-term trend using a few indicators.
We will be using a 200-period Exponential Moving Average (EMA) to identify the long-term trend bias. The trend will simply be based on the location of price in relation to the 200 EMA line, as well as the slope of the 200 EMA line.
We will then confirm the trend using the ADX line of the ADX indicator. Instead of using the 25 mark as the basis for the trend, we will be using the 20 mark. The line should be above 20 to warrant a trending market condition. The ADX line should also start to curl up indicating that the market is picking up momentum. Trend direction will also be confirmed based on how the DMI+ and DMI- lines are stacked.
Finally, we will be identifying the more immediate shorter-term trends based on the MACD Dot signal. Trades will be taken only in the direction of the long-term trend.
Indicators:
- Macd-dot
- 200 EMA
- Average Directional Movement Index
Preferred Time Frames: 30-minute, 1-hour and 4-hour charts
Currency Pairs: FX majors, minors and crosses
Trading Sessions: Tokyo, London and New York sessions
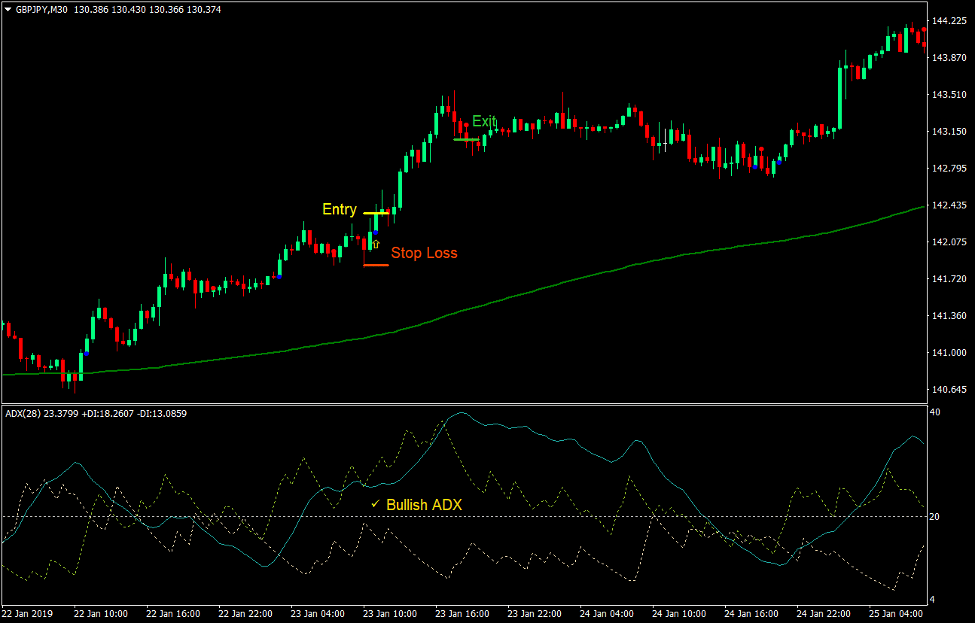
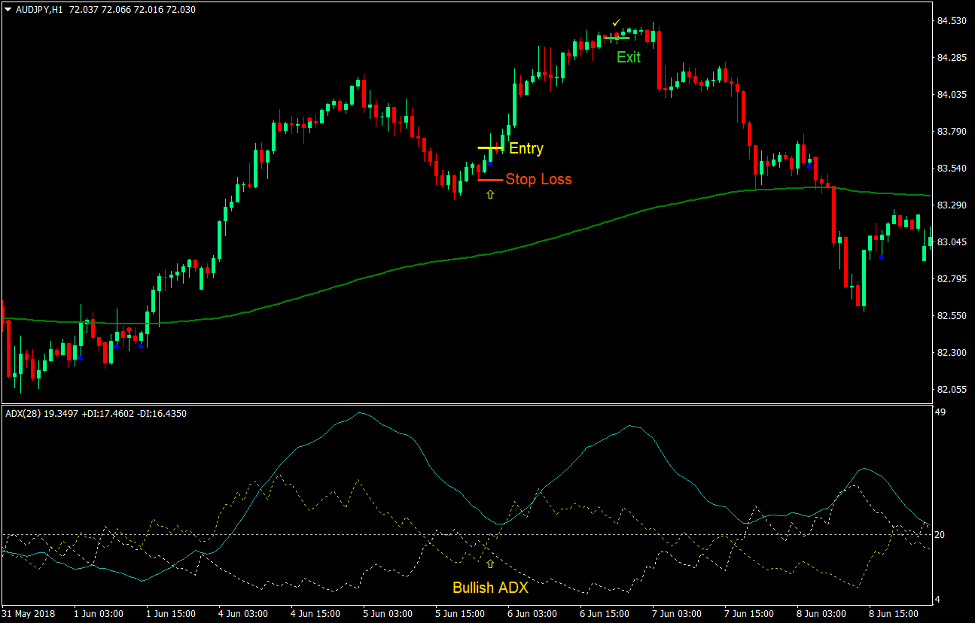
Buy Trade Setup
Entry
- Price should be above the 200 EMA line.
- The 200 EMA line should be sloping up.
- The ADX line should be above 20.
- The ADX line should be curling up.
- The DMI+ line (yellow green) should be above the DMI- line (wheat).
- The MACD Dot indicator should plot a blue dot below price
- Enter a buy order upon the confirmation of the conditions above.
Stop Loss
- Set the stop loss on the fractal below the entry candle.
Exit
- Close the trade as soon as the MACD Dot indicator plots a red dot.
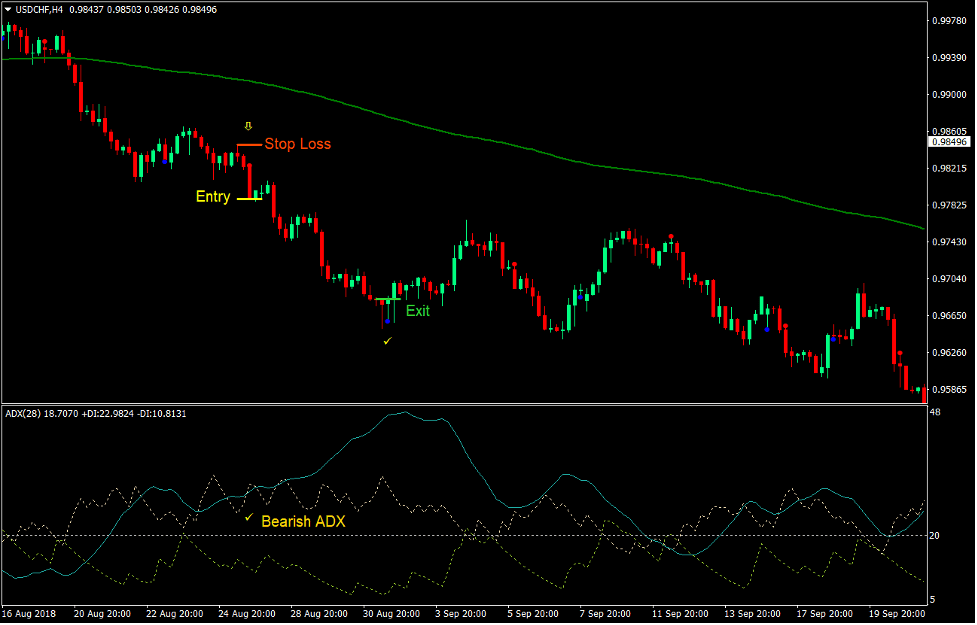
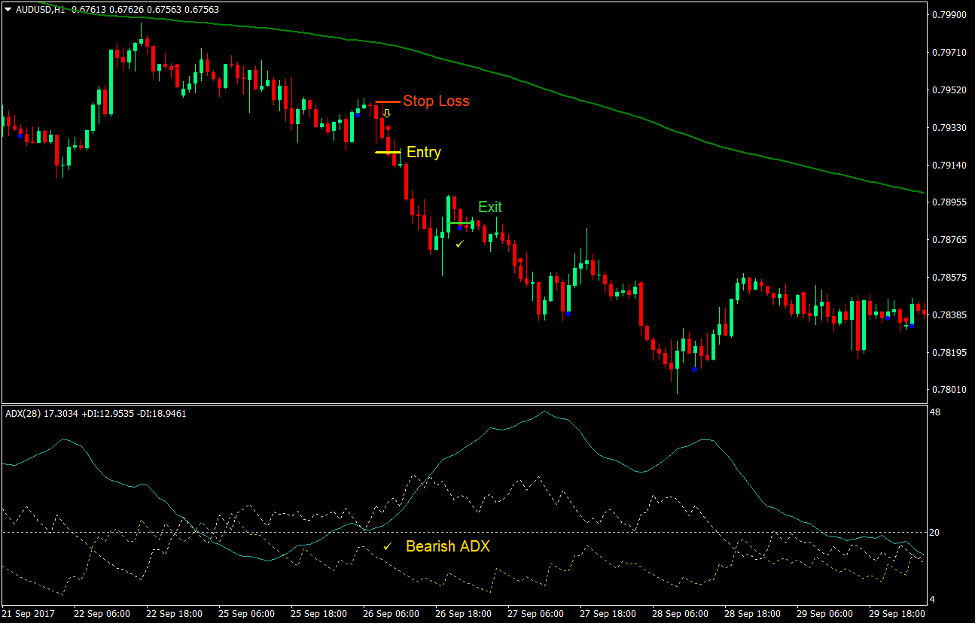
Sell Trade Setup
Entry
- Price should be below the 200 EMA line.
- The 200 EMA line should be sloping down.
- The ADX line should be above 20.
- The ADX line should be curling up.
- The DMI+ line (yellow green) should be below the DMI- line (wheat).
- The MACD Dot indicator should plot a red dot above price
- Enter a sell order upon the confirmation of the conditions above.
Stop Loss
- Set the stop loss on the fractal above the entry candle.
Exit
- Close the trade as soon as the MACD Dot indicator plots a blue dot.
Conclusion
This trading strategy is a working trading strategy which works best on markets that are clearly trending on the long-term. This could be identified by zooming out the chart or looking at the higher timeframes.
It is basically a trend following strategy that trades on deep retracements, which allows the short-term trend based on the MACD to temporarily reverse.
Traders could use this as a final entry signal while incorporating other indications such as minor trendline breaks and divergences.
Recommended MT4 Brokers
XM Broker
- Free $50 To Start Trading Instantly! (Withdraw-able Profit)
- Deposit Bonus up to $5,000
- Unlimited Loyalty Program
- Award Winning Forex Broker
- Additional Exclusive Bonuses Throughout The Year

>> Sign Up for XM Broker Account here <<
FBS Broker
- Trade 100 Bonus: Free $100 to kickstart your trading journey!
- 100% Deposit Bonus: Double your deposit up to $10,000 and trade with enhanced capital.
- Leverage up to 1:3000: Maximizing potential profits with one of the highest leverage options available.
- ‘Best Customer Service Broker Asia’ Award: Recognized excellence in customer support and service.
- Seasonal Promotions: Enjoy a variety of exclusive bonuses and promotional offers all year round.

>> Sign Up for FBS Broker Account here <<
Click here below to download: