


The understanding of Support and Resistance is probably one of the most fundamental knowledge that a technical traders should have, along with other key elements in technical analysis. This is because the understanding of Support and Resistance provides traders the basic tools to shift their perspective from being a reactive trader to one who anticipates where price may move towards, where it may reverse, and where it may stop. Traders who understand Support and Resistance often has the perspective of waiting for the optimal areas where to enter the market rather than chasing price movements.
The strategy that will be discussed below is an example of how we can use support and resistance to anticipate key locations on the price chart where price may reverse. It also uses the Fisher RVI Indicator as an additional tool to confirm trade entries.
Swing High – Swing Low Support and Resistance Areas
Different traders have different approaches when plotting their support and resistance levels. Some would use diagonal trendlines as a basis for support and resistance, while others only consider horizontal support and resistance levels. Others would plot the lines based on the wicks, while others would base it on the bodies of the candle.
However, one of the most effective ways that many professional traders use when plotting support and resistance is by looking at major swing highs and swing lows as the basis for plotting the support and resistance areas. This is a very logical approach because price had already reversed from that level in the past. We could then assume that a lot of traders are looking to buy or sell in those areas.
Some traders call these areas as supply and demand zones, which is understandable because the reversals causing the price swings indicate that there is supply or demand in that area.
Other seasoned traders call it as an order block, and rightfully so because it was an area where a huge number of orders were filled and more pending orders from the institutional level could also be waiting to be filled.
For the sake of simplification, let us call it as Support and Resistance Areas. Note that we called it an area instead of a line. This is because reversals are usually not exact as different traders have different price levels where they are willing to make the trade.
To do this, we are to note the congestion zones of the major swing highs and swing lows. We could then mark the area of the zones where price reversed as our support or resistance area.

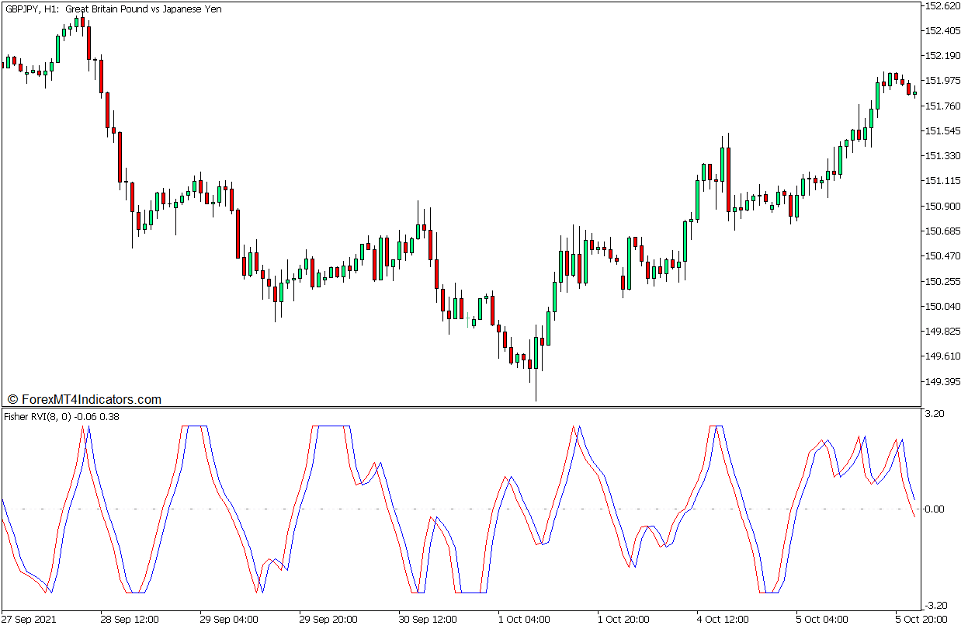
Fisher RVI Indicator
The Fisher RVI Indicator is a custom technical indicator which is based on the concepts discussed by John Ehlers in his article, “Using the Fisher Transform”, which was published in November of 2002 in the magazine, “Technical Analysis of Stock and Commodities”. The indicator however was originally developed by Witold Wozniak.
This indicator modifies the basic Relative Vigor Index (RVI) indicator by using the concept of the Inverse Fisher Transform as discussed by John Ehlers. This improves on the basic RVI indicator, allowing the indicator to highlight price extremes based on recent historical prices, and provide a reversal signal.
This indicator plots two lines which oscillate around a midline, which is zero. The red line is the main Fisher RVI line, while the blue line is the Trigger line. Momentum direction is indicated by the location of the Fisher RVI line in relation to the Trigger line. The lines would flatten out either at the top or bottom of the range whenever the market is in a price extreme. Crossovers between the two lines also typically indicate that the market momentum could potentially reverse.
Trading Strategy Concept
Fisher RVI Support and Resistance Reversal Forex Trading Strategy for MT5 is a momentum reversal trading strategy which anticipates potential price reversals on Support and Resistance Areas and uses the Fisher RVI Indicator as its momentum reversal signal.
To do this, traders should first identify where the recent major swing highs and swing lows are. Traders should then mark the congestion zones formed on the swing highs and swing lows, indicating the support or resistance area.
The next step would be to wait for price to revisit the area. If the Fisher RVI Indicator shows an overbought or oversold market condition while in the area, we could then anticipate for a potential momentum reversal.
The entry signal would be the crossover of the Fisher RVI line and its Trigger line in confluence with price action showing signs of a momentum reversal as indicated by an engulfing candle.
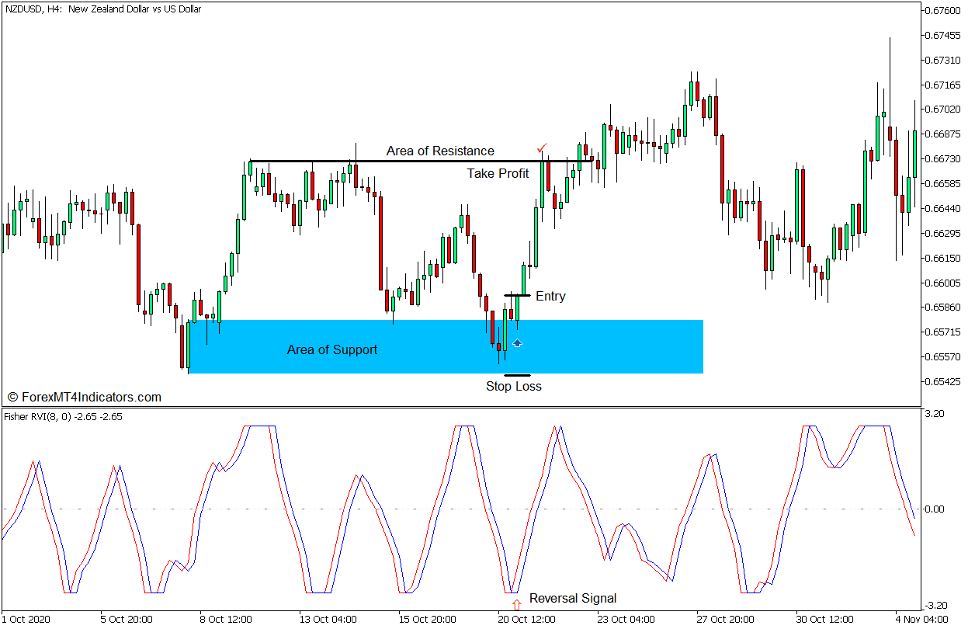
Buy Trade Setup
Entry
- Mark the congestion zone of the most recent major swing low as a Support Area.
- Wait for price to revisit the area.
- The Fisher RVI lines should flatten out at the bottom of its range.
- Open a buy order on the confluence of a bullish momentum reversal price action and the crossing over of the red Fisher RVI line above the blue line.
Stop Loss
- Set the stop loss below the Support Area.
Exit
- Set the take profit target on the next Resistance Area.
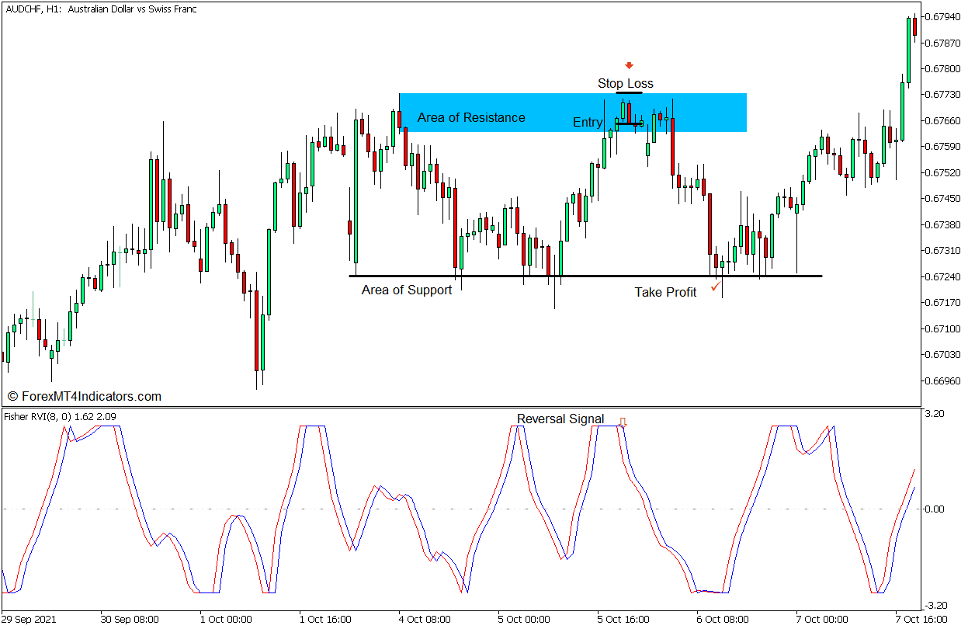
Sell Trade Setup
Entry
- Mark the congestion zone of the most recent major swing high as a Resistance Area.
- Wait for price to revisit the area.
- The Fisher RVI lines should flatten out at the top of its range.
- Open a sell order on the confluence of a bearish momentum reversal price action and the crossing over of the red Fisher RVI line below the blue line.
Stop Loss
- Set the stop loss above the Resistance Area.
Exit
- Set the take profit target on the next Support Area.
Conclusion
This type of trading strategy is commonly used by market flow traders and supply and demand traders. However, this method has a slight modification to the two basic strategy types mentioned. This strategy uses the Fisher RVI as a confirmation signal for the trade entries. This allows traders to have an objective basis for opening the trade.
This style of trading can be a very effective way to trade the market. However, it is imperative that traders learn how to properly identify the major support and resistance areas to use this strategy effectively.
Recommended MT5 Brokers
XM Broker
- Free $50 To Start Trading Instantly! (Withdraw-able Profit)
- Deposit Bonus up to $5,000
- Unlimited Loyalty Program
- Award Winning Forex Broker
- Additional Exclusive Bonuses Throughout The Year

>> Sign Up for XM Broker Account here <<
FBS Broker
- Trade 100 Bonus: Free $100 to kickstart your trading journey!
- 100% Deposit Bonus: Double your deposit up to $10,000 and trade with enhanced capital.
- Leverage up to 1:3000: Maximizing potential profits with one of the highest leverage options available.
- ‘Best Customer Service Broker Asia’ Award: Recognized excellence in customer support and service.
- Seasonal Promotions: Enjoy a variety of exclusive bonuses and promotional offers all year round.

>> Sign Up for FBS Broker Account here <<
Click here below to download: