


Trend olan bir piyasa koşulunda trend devam stratejisini ticarete dökmenin birçok yolu vardır. Dinamik Destek veya Direnç Alanı kullanarak geri çekilmeler üzerinde işlem yapmak, muhtemelen tacirlerin bu tür ticaret stratejisiyle işlem yapabilmesinin en basit yollarından biridir. Bir tüccarın, fiyatın geri çekileceği alanı belirledikten sonra ihtiyaç duyacağı ticaret düzeninin tek unsuru, ticarete giriştir.
Aşağıdaki strateji, OsHMA Göstergesini bir trend devam türü stratejide kullanıldığında ticarete giriş sinyali olarak nasıl kullanabileceğimizi gösterir.
OsHMA Göstergesi
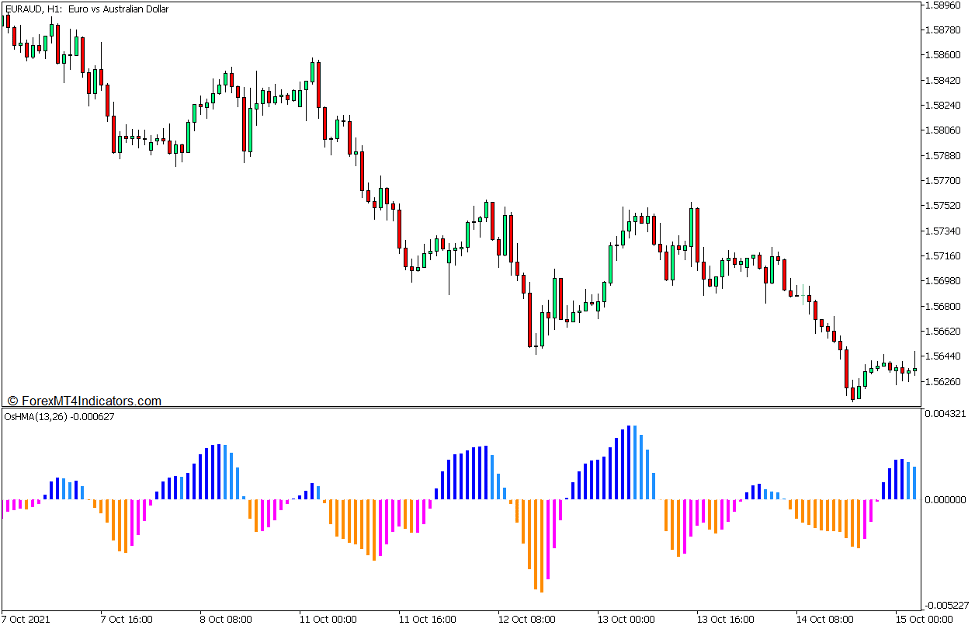
OsHMA Göstergesi, yatırımcıların momentum yönünü belirlemesine yardımcı olmak için geliştirilmiş özel bir göstergedir. Momentum yönünü, sıfır olan bir orta çizgi etrafında salınan histogram çubuklarını çizen osilatör tipi bir teknik gösterge olarak sunar.
Bu gösterge, Hareketli Ortalama Göstergesi Osilatörü veya OsMA'nın bir modifikasyonudur. Temel OsMA göstergesi, Hareketli Ortalama Yakınsama ve Sapma (MACD) göstergesi gibi başka bir osilatörden türetilen bir osilatördür. OsMA göstergesi temel olarak temeldeki osilatörün hareketli ortalamasını hesaplar, ardından osilatörün değerini ve hareketli ortalamasını çıkarır.
Öte yandan OsHMA Göstergesi, Gövde Hareketli Ortalaması (HMA) olan temel osilatörünün ortalamasını hesaplamak için değiştirilmiş bir hareketli ortalama çizgisi kullanır. Gövde Hareketli Ortalaması, düzleştirilmiş bir hareketli ortalama çizgisi oluşturmak ve aynı zamanda daha az gecikme ile duyarlı bir hareketli ortalama çizmek için geliştirildi. OsHMA Göstergesi, hareketli ortalamaları hesaplamak için yöntemi olarak HMA'yı kullandığından, OsHMA Göstergesinin çizdiği çubuk salınımları, daha az gecikmeye sahip olma konusunda mükemmel bir dengeye sahiptir, ancak aynı zamanda piyasa gürültüsünden daha az hassastır.
OsHMA Göstergesi, sıfır etrafında salınan histogram çubuklarını çizer. Çizdiği çubukların rengi, çubukların pozitif veya negatif olmasına ve değerinin bir önceki çubuğa göre daha yüksek veya daha düşük olmasına bağlı olarak da değişir. Artan değerlere sahip pozitif çubuklar için mavi çubuklar ve düşen değerlere sahip pozitif çubuklar için sıyrık mavi çubuklar çizer. Öte yandan, düşen değerlere sahip negatif çubuklar için turuncu çubuklar ve artan değerlere sahip negatif çubuklar için macenta çubuklar da çizer. Bu özellik, kullanıcıların momentum yönünün yanı sıra potansiyel momentum tersine dönüşlerini kolayca tanımlamasına olanak tanır.
Dinamik Destek ve Direnç Alanı
Çoğu tüccar, destek ve direnç seviyeleri kavramına aşinadır. Bununla birlikte, Dinamik Destek ve Direnç Alanı kavramı bazıları için yeni olabilir.
Bazı hareketli ortalama çizgileri ile birlikte fiyat hareketini ve piyasa yapılarını gözlemlerseniz, fiyatın tipik olarak hareketli bir ortalama çizginin yakınındaki alan etrafında sıçradığını fark edeceksiniz. Bu, tipik olarak, trend halindeki bir piyasa koşulu sırasında piyasanın geri çekildiği durumlar için geçerlidir.
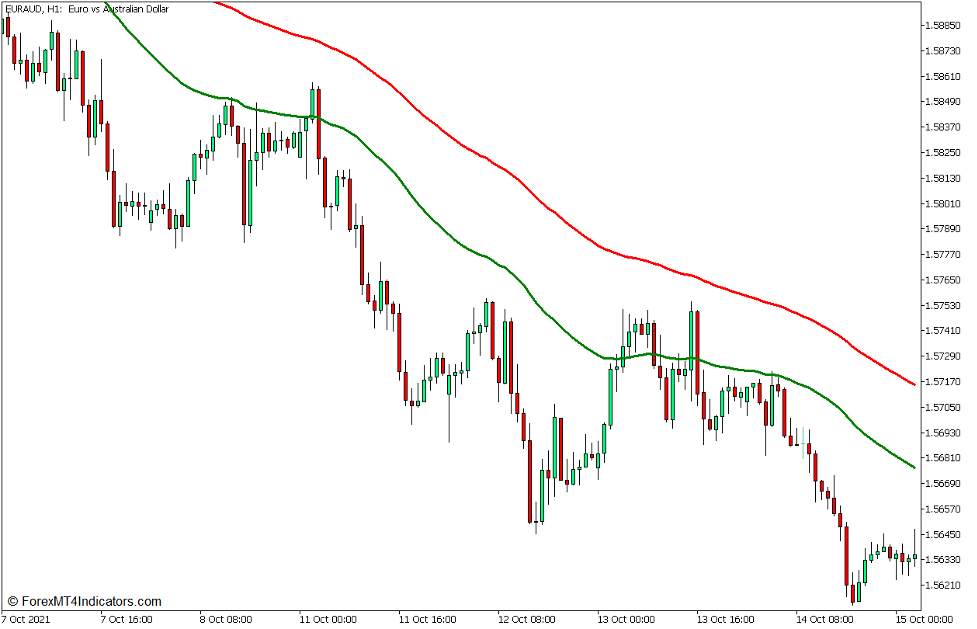
Dinamik Destek ve Direnç Alanı, statik veya tek bir seviye veya hatta sabit olmayan destek ve direnç seviyeleri olarak işlev görebilen alanlardır. Bunun yerine, bu tür destek ve direnç, fiyat hareketinin hareketlerine bağlı olarak dinamik olarak değişir ve hareket eder. Ayrıca genellikle, piyasanın tersine dönebileceği doğal olarak destek ve direnç seviyeleri olan bir çift veya bir dizi hareketli ortalama çizgisine dayanır. Tüccarlar, iki hareketli ortalama çizgisi arasındaki alanda potansiyel piyasa tersine dönüşlerini gözlemleyebilir. Desteğin veya direncin yönü, daha hızlı olan çizginin daha yavaş olan çizgiye göre nerede olduğuna bağlıdır. Daha hızlı hareket eden ortalama, daha yavaş hareket eden ortalamanın üzerindeyse, alan bir destek alanıdır. Tersine, daha hızlı hareket eden ortalama çizgisinin daha yavaş hareket eden ortalama çizgisinin altında olması bir direnç alanıdır. Fiyat eylemi, daha yavaş hareket eden ortalama çizgisini güçlü bir ivmeyle aşarsa, tüccarlar piyasanın ters trend yönüne dönme olasılığını değerlendirebilir.
Aşağıda, düşüş trendi olan bir piyasada Dinamik Direnç Alanı görevi gören 50 EMA ve 100 EMA çizgisinin bir örneği bulunmaktadır.
Ticaret Stratejisi Kavramı
OsHMA Dinamik Trend Devam Forex Ticaret Stratejisi, Dinamik Destek veya Direnç Alanı için temel olarak 50 Üstel Hareketli Ortalama (EMA) ve 100 EMA çizgisini kullanan bir trend devam stratejisidir.
Tüccarlar, 50 EMA çizgisinin 100 EMA çizgisine göre konumuna göre trend yönünü belirleyebilir ve onaylayabilir. Daha sonra, 50 EMA ve 100 EMA hatları arasındaki alanda pazar geri çekilmeleri veya konsolidasyon aşamaları bekleriz.
Fiyat hareketi 50 EMA ve 100 EMA çizgisi arasına dokunur veya bu bölgeye girer girmez, tüccarlar olası momentum tersine dönüşlerini gözlemlemeye başlayabilir.
Momentumun tersine çevrilmesini belirlemek için OsHMA Göstergesini kullanacağız. Giriş sinyali, momentumun tersine döndüğünü gösteren OsHMA çubuklarının renk değişimine dayalı olacaktır.
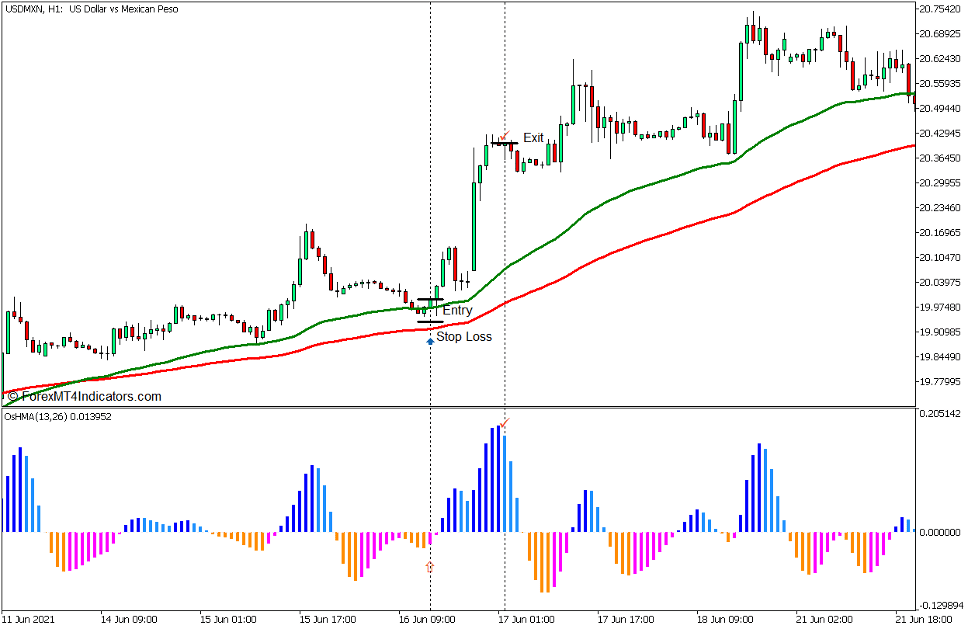
Ticaret Kurulumu Satın Al
Girdi
- 50 EMA çizgisi (yeşil) 100 EMA çizgisinin (kırmızı) üzerinde olmalıdır.
- Fiyatın 50 EMA ve 100 EMA çizgisi arasındaki alana geri çekilmesine izin verin.
- OsHMA çubukları macentaya döner dönmez bir satın alma emri açın.
Zarar Durdur
- Durdurma kaybını giriş mumunun altına ayarlayın.
Çıkış
- Fiyatın sallanan yüksek seviyenin üzerinde yükselmesine izin verin ve ardından OsHMA çubukları maviye döner dönmez ticareti kapatın.
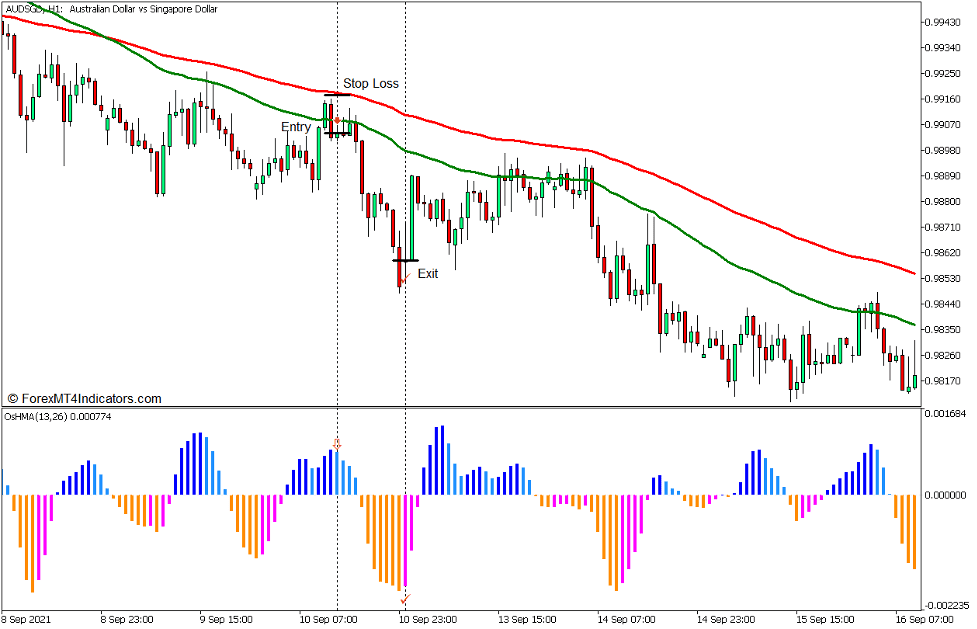
Ticaret Kurulumu Sat
Girdi
- 50 EMA çizgisi (yeşil) 100 EMA çizgisinin (kırmızı) altında olmalıdır.
- Fiyatın 50 EMA ve 100 EMA çizgisi arasındaki alana geri çekilmesine izin verin.
- OsHMA çubukları maviye döner dönmez bir satış emri açın
Zarar Durdur
- Durdurma kaybını giriş mumunun üzerine ayarlayın.
Çıkış
- Fiyatın düşük seviyenin altına düşmesine izin verin ve ardından OsHMA çubukları macentaya döner dönmez ticareti kapatın.
Sonuç
Dinamik Destek veya Direnç Alanı kullanan trend devam stratejileri, özellikle doğru piyasa senaryosunda kullanıldığında piyasada işlem yapmanın etkili bir yoludur. Bu strateji, OsHMA Göstergesini kullanarak objektif bir ticarete giriş sinyali sağlayarak bu tür bir stratejinin alım satım sürecini basitleştirir.
Bu strateji, piyasada işlem yapmanın etkili bir yolu olabilse de, yine de en iyi şekilde piyasa yapısının doğru bir şekilde anlaşılmasıyla birlikte kullanılır.
Önerilen MT5 Komisyoncuları
XM Broker
- Ücretsiz $ 50 Anında Ticarete Başlamak için! (Çekilebilir Kar)
- Para Yatırma Bonusu $5,000
- Sınırsız Sadakat Programı
- Ödüllü Forex Brokerı
- Ek Özel Bonuslar Yıl boyunca

>> XM Broker Hesabına buradan kaydolun <
FBS Aracısı
- Ticaret 100 Bonus: Ticaret yolculuğunuza başlamak için ücretsiz 100$!
- 100% Depozito: Yatırdığınız parayı 10,000$'a kadar ikiye katlayın ve artırılmış sermayeyle işlem yapın.
- 1'e kadar kaldıraç: 3000: Mevcut en yüksek kaldıraç seçeneklerinden biriyle potansiyel kârı en üst düzeye çıkarmak.
- 'Asya'nın En İyi Müşteri Hizmetleri Komisyoncusu' Ödülü: Müşteri desteği ve hizmetinde tanınan mükemmellik.
- Mevsimsel Promosyonlar: Tüm yıl boyunca çeşitli özel bonusların ve promosyon tekliflerinin keyfini çıkarın.

>> FBS Broker Hesabına buradan kaydolun <
İndirmek için aşağıya tıklayın: