


Trendin tersine çevrilmesi, yatırımcıların kâr edebileceği en karlı ticaret senaryolarından bazılarıdır. Trend olan piyasalar oldukça uzun bir süre tek yönde devam etme eğilimindedir. Bu, trendin başlangıcına yakın bir zamanda trendin tersine döndüğünü tahmin edebilen yatırımcıların böyle bir ticaretten büyük oranda kar elde etmelerini sağlar. Pipler trend tersine dönen tüccarın yaptığı ticaret yönünde hareket ettikçe kârlar yükselebilir.
Ticaret trendinin tersine çevrilmesi çok iyi bir fikir gibi görünse de, genellikle bunu söylemek yapmaktan daha kolaydır. Bunun nedeni trendin tersine dönüşlerini tahmin etmenin çok zor olmasıdır. Çoğu zaman, yatırımcılar derin geri çekilmeleri yanlışlıkla trendin tersine çevrilmesi sinyali olarak algılarlar ve bu da onların güçlü bir hakim trendin yönüne karşı ticaret yapmasına neden olur.
Trend dönüşlerinden büyük oranda kar elde etmek için yatırımcıların ihtiyaç duyduğu şey, trend dönüşlerini öngörmek için mantıklı ve sistematik bir yönteme sahip olmaktır.
Trendin tersine döndüğünü tahmin etmenin en iyi yollarından biri hareketli ortalamaların çapraz geçişlerini kullanmaktır. Doğru parametreler ve ticaret kurulumları ile hareketli ortalama geçişleri, hareketli ortalama çizgisinin yavaşlayan hareketli ortalama çizgisi üzerinden geçişine dayalı olarak potansiyel trend dönüşlerini sistematik olarak tespit edebilir. Ancak hareketli ortalama geçişlerinin tümü işe yaramaz. Bazı kurulumlar diğerlerinden daha iyidir. Değiştirilmiş hareketli ortalamaların ve özel teknik göstergelerin kullanıldığı durumlar da vardır.
Donchian Kanallar
Donchian Kanalları, Richard Donchian tarafından geliştirilen, bant bazlı, trendi takip eden bir teknik göstergedir.
Belirli bir süre veya mum sayısı içerisinde en yüksek en yüksek ve en düşük en düşük fiyat hareketinin alınmasıyla oluşur. Donchian Kanalının orta çizgisi, belirtilen aralığın ortancasına göre çizilir. Aynı fiyat aralığının en yüksek ve en düşük dipleri aynı zamanda Donchian Kanalı'nın üst ve alt bantları tarafından da işaretlenir.
Donchian Kanalı, diğer bant veya kanal bazlı teknik göstergelere benzer şekilde kullanılabilir. Fiyatın üst ve alt bantların üstüne çıkması veya altına düşmesi olası bir momentum kırılmasına işaret edebilir. Söz konusu alanda ret işaretleri gösteren fiyat hareketleri de olası bir ortalamanın tersine döndüğünü gösterebilir.
Donchian Kanalının orta çizgisi de diğer hareketli ortalama çizgileri gibi kullanılabilir. Fiyat hareketinin genel konumuna bağlı olarak trendin yönünü belirlemek için kullanılabilir.
Üçgen Hareketli Ortalama
Üçgen Hareketli Ortalama (TMA), temel hareketli ortalama çizgisinin değiştirilmiş bir versiyonudur.
Hareketli ortalamalar teknik göstergelerin ardından en yaygın kullanılan trendlerden biridir. Basitliği ve etkinliği, yatırımcıların bir trendin yönünü kolayca anlamalarına olanak tanır. Yatırımcılar, fiyat hareketinin hareketli ortalama çizgisine göre genel konumuna ve çizginin eğim yönüne bağlı olarak trend yönünü belirleyebilirler.
Basitliğine ve etkililiğine rağmen hareketli ortalamalar, aralık sınırı olan piyasalarda sıklıkla meydana gelen yanlış sinyallere karşı duyarlı olma eğilimindedir.
Üçgen Hareketli Ortalama, değiştirilmiş bir hesaplamaya dayalı olarak hareketli ortalama çizgisini yumuşatarak bu sorunu çözmeye çalışır. Aslında TMA çifti hareketli ortalama çizgisini düzleştirir. Bu, daha istikrarlı olma eğiliminde olan bir hat oluşturarak yanlış sinyallere karşı daha az duyarlı olmasını sağlar.
Göreceli Güç Endeksi
Göreceli Güç Endeksi (RSI), osilatör olarak çizilen klasik bir momentum teknik göstergesidir.
RSI, orta noktası 0 olan, 100 ila 50 aralığında salınan bir çizgi çizer. 50'nin üzerinde kalan bir RSI çizgisi yükseliş eğilimi eğilimini gösterirken, 50'nin altında kalan RSI çizgisi düşüş eğilimi eğilimini gösterir.
Aynı zamanda tipik olarak 30 ve 70 seviyesinde belirteçlere sahiptir. Fiyat hareketi düşüş eğilimi işaretleri gösterirken 70'in üzerinde bir RSI çizgisi, fiyatın aşırı alımda olduğunu ve ortalama bir tersine dönüş zamanı geldiğini gösterebilir. Öte yandan, fiyat hareketi yükseliş eğilimi gösterirken RSI çizgisinin 30'un altında olması, fiyatın aşırı satış olduğu ve yükseliş ortalamasının tersine döneceği anlamına gelebilir.
Momentum yatırımcıları ise 70'in üzerindeki ve 30'un altına düşen kırılmaları güçlü bir momentumun göstergesi olarak görüyor. Özetle, fiyat hareketinin tersine dönme işaretleri mi yoksa güçlü bir momentum kırılması mı gösterdiğine bakılmaksızın, bu koşullar sırasındaki fiyat hareketinin özellikleridir.
Bazı tüccarlar trenddeki piyasaları doğrulamak için fiyat tablosuna 45 ve 55. seviyeleri ekliyor. Seviye 45, yükseliş eğilimi sırasında destek seviyesi görevi görür. Seviye 55, düşüş eğilimi sırasında bir direnç seviyesi görevi görür.
Ticaret Stratejisi
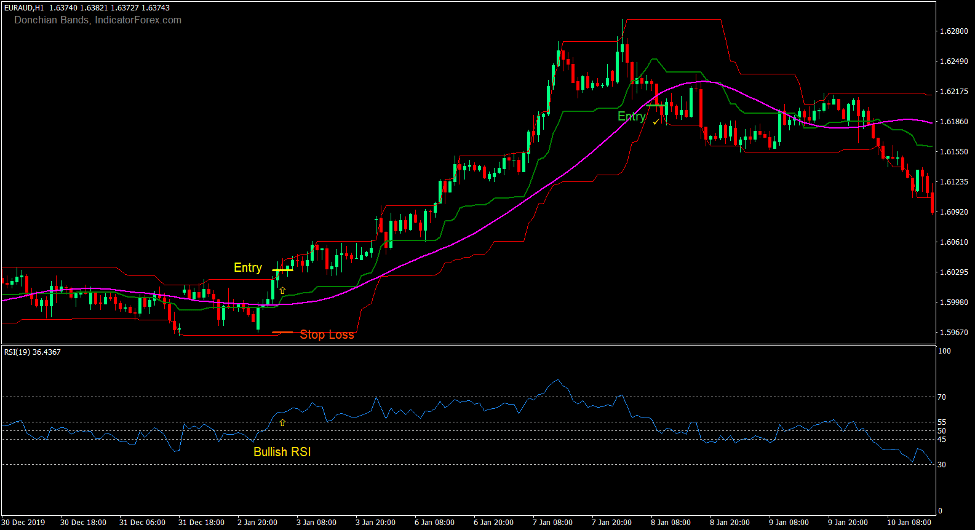
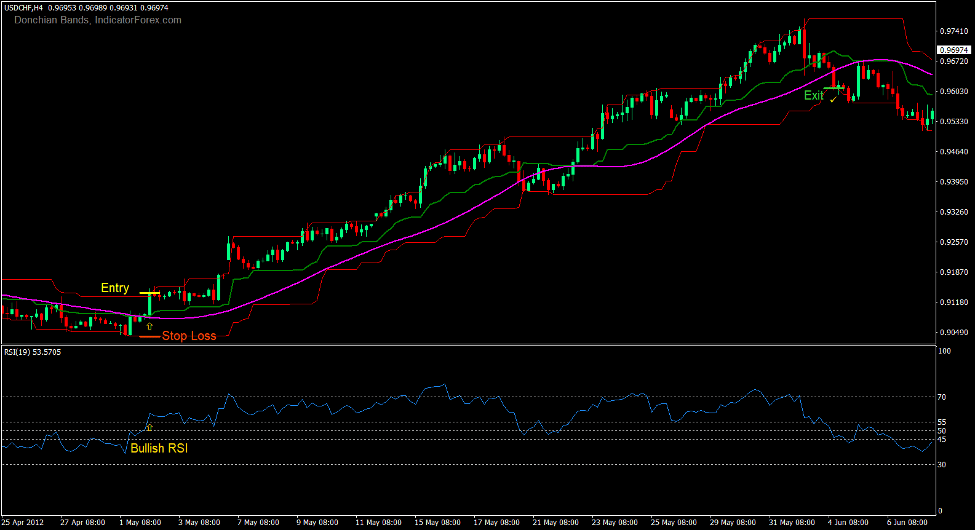
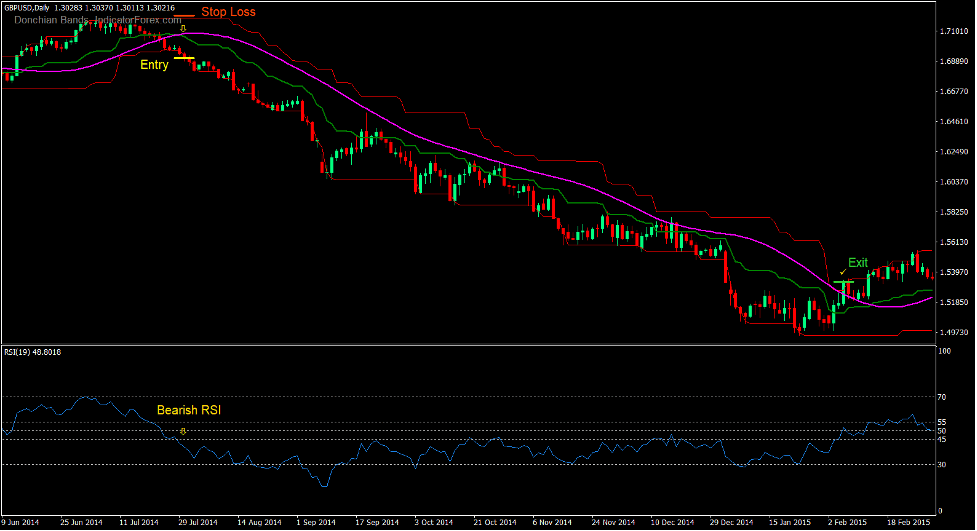
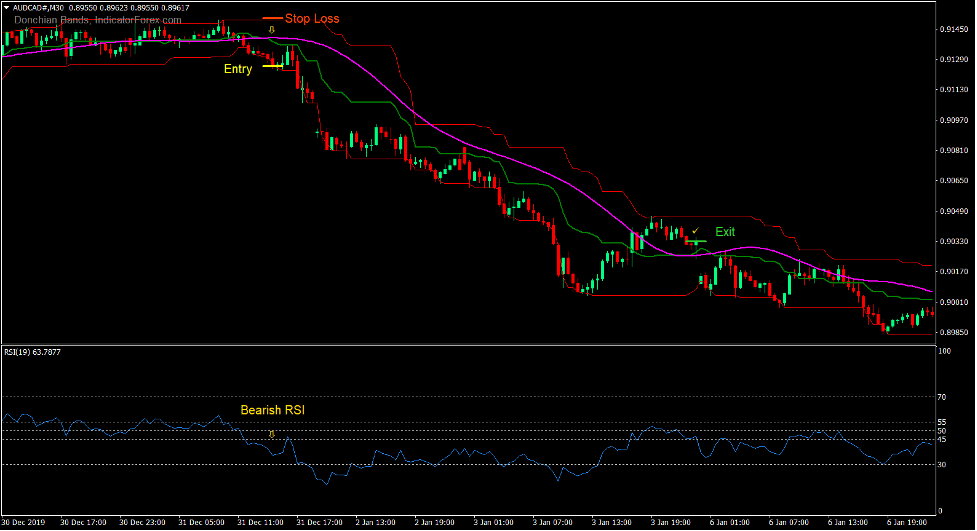
Donchian MA Çapraz Forex Ticaret Stratejisi, teknik göstergeleri takip eden iki trendin çaprazlamasına dayanan basit bir trend tersine çevirme stratejisidir.
Trendin tersine çevrilmesi kurulumları, Donchian Kanalı ile TMA hattının orta hattının kesişmesine göre tanımlanır.
Trendin tersine dönmesi, RSI çizgisinin yükseliş eğiliminde 55'in üzerine çıkması veya düşüş eğiliminde 45'in altına düşmesiyle teyit edilmelidir. Bu durumda çizgi, yükseliş eğilimindeki bir destek olarak 45. seviyeye veya ticaret kurulumunun bir eğilime dönüşmesi durumunda düşüş eğilimindeki bir direnç olarak 55. seviyeye saygı duyacaktır.
Momentum, Donchian Kanalı dışındaki fiyat kapanışlarına göre de doğrulandı.
Göstergeler:
- Donchian Bantları
- TMA
- Dönemler: 36
- Göreceli Güç Endeksi
- Dönem: 19
Tercih Edilen Zaman Çerçeveleri: 30 dakikalık, 1 saatlik, 4 saatlik ve günlük grafikler
Döviz Çifti: FX majörler, minörler ve haçlar
Ticaret Oturumları: Tokyo, Londra ve New York oturumları
Ticaret Kurulumu Satın Al
Girdi
- Donchian Kanallarının orta çizgisi TMA çizgisinin üzerinden geçmelidir.
- RSI çizgisi 55'in üzerinde olmalıdır.
- Yükseliş mumu Donchian Kanalı'nın üst çizgisinin üzerinde kapanmalı.
- Bu koşulların onaylanması üzerine bir satın alma siparişi girin.
Zarar Durdur
- Giriş mumunun altındaki bir destekte kaybı durdurun.
Çıkış
- Fiyat Donchian Kanalı'nın alt çizgisinin altında kapanır kapanmaz işlemi kapatın.
- Donchian Kanalı'nın orta çizgisi TMA çizgisinin altına geçtiğinde ticareti kapatın.
Ticaret Kurulumu Sat
Girdi
- Donchian Kanallarının orta çizgisi TMA çizgisinin altından geçmelidir.
- RSI çizgisi 45'in altına geçmelidir.
- Düşüş mumu Donchian Kanalı'nın alt çizgisinin altında kapanmalıdır.
- Bu koşulların onaylanması üzerine bir satış emri girin.
Zarar Durdur
- Stop Loss'u giriş mumunun üzerindeki bir dirence ayarlayın.
Çıkış
- Fiyat Donchian Kanalı'nın üst çizgisinin üzerinde kapanır kapanmaz işlemi kapatın.
- Donchian Kanalı'nın orta çizgisi TMA çizgisinin üzerine geçtiği anda ticareti kapatın.
Sonuç
Bu ticaret stratejisi, doğru piyasa koşullarında çok işe yarayabilecek basit bir trend tersine çevirme stratejisidir. Güçlü bir şekilde tersine dönme eğilimi olan ve derin fiyat dalgalanmalarının olduğu piyasalarda oldukça etkilidir.
Bu stratejiyi momentum kırılma fiyat hareketi senaryolarıyla birlikte işlemek de en iyisidir.
Önerilen MT4 Komisyoncuları
XM Broker
- Ücretsiz $ 50 Anında Ticarete Başlamak için! (Çekilebilir Kar)
- Para Yatırma Bonusu $5,000
- Sınırsız Sadakat Programı
- Ödüllü Forex Brokerı
- Ek Özel Bonuslar Yıl boyunca

>> XM Broker Hesabına buradan kaydolun <
FBS Aracısı
- Ticaret 100 Bonus: Ticaret yolculuğunuza başlamak için ücretsiz 100$!
- 100% Depozito: Yatırdığınız parayı 10,000$'a kadar ikiye katlayın ve artırılmış sermayeyle işlem yapın.
- 1'e kadar kaldıraç: 3000: Mevcut en yüksek kaldıraç seçeneklerinden biriyle potansiyel kârı en üst düzeye çıkarmak.
- 'Asya'nın En İyi Müşteri Hizmetleri Komisyoncusu' Ödülü: Müşteri desteği ve hizmetinde tanınan mükemmellik.
- Mevsimsel Promosyonlar: Tüm yıl boyunca çeşitli özel bonusların ve promosyon tekliflerinin keyfini çıkarın.

>> FBS Broker Hesabına buradan kaydolun <
İndirmek için aşağıya tıklayın: