


3TF RSI Ortalama MT5 Göstergesi. MetaTrader 5 platformu için özel olarak tasarlanan bu yenilikçi gösterge, Göreceli Güç Endeksi'nin (RSI) öngörülerini birden fazla zaman diliminde birleştirerek yatırımcılara güç verir. Bu kapsamlı kılavuzda, 3TF RSI Ortalama MT5 Göstergesi dünyasına dalacağız, işlevlerini açıklığa kavuşturacağız, uygulamalarını keşfedeceğiz ve sizi ticaret stratejilerinizde etkili bir şekilde kullanmanız için gerekli bilgilerle donatacağız.
Yapı Taşlarını Anlamak
3TF RSI Ortalamasına dalmadan önce temel bileşenlerini anlayarak sağlam bir temel oluşturalım:
Göreceli Güç Endeksi (Rsi)
J. Welles Wilder tarafından geliştirilen RSI, bir varlığın aşırı alım ve aşırı satım koşullarını ölçmek için son fiyat değişikliklerinin büyüklüğünü ölçen, yaygın olarak kullanılan bir momentum osilatörüdür. Tipik olarak 0 ila 100 arasında değişir; 70'in üzerindeki okumalar aşırı alım bölgesini, 30'un altındaki değerler ise aşırı satış koşullarını gösterir.
Teknik Analizde Zaman Çerçeveleri
Teknik analiz, ağırlıklı olarak kısa vadeden (dakika) uzun vadeye (ay) kadar değişen çeşitli zaman dilimlerindeki fiyat hareketlerinin incelenmesine dayanır. Grafiklerin farklı zaman aralıklarında analiz edilmesi, potansiyel giriş ve çıkış noktalarının belirlenmesine, temel eğilimlerin değerlendirilmesine ve piyasa duyarlılığının ölçülmesine yardımcı olur.
3tf Rsi Ortalama Mt5 Göstergesini Yapılandırma
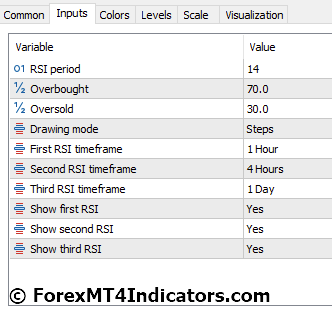
3TF RSI Ortalama MT5 Göstergesi, giriş parametreleri aracılığıyla çeşitli özelleştirme seçenekleri sunar. Bazı önemli parametreleri inceleyelim:
- RSI Dönemi: Bu parametre, her zaman dilimi için RSI'yi hesaplamak için kullanılan fiyat çubuklarının sayısını tanımlar. Daha yüksek bir dönem göstergeyi yumuşatır ve oynaklığı azaltır; daha düşük bir dönem ise daha duyarlı sinyaller sağlar ancak gürültüye yatkın olabilir.
- Aşırı Alım ve Aşırı Satış Seviyeleri: Bu seviyeler aşırı alım ve aşırı satım koşullarını belirlemek için eşikleri tanımlar. Geleneksel olarak 70 ve 30 kullanılır ancak yatırımcılar risk toleranslarına ve ticaret tarzlarına göre bunları ayarlayabilirler.
- Çizim Modu: Bu parametre, göstergenin grafikte nasıl görüntüleneceğini belirler. Seçenekler arasında çizgiler, çubuklar ve histogramlar bulunur.
- Zaman Dilimi Seçimi: Bu, yatırımcıların RSI'nın hesaplanacağı belirli zaman dilimlerini seçmesine olanak tanır. Popüler kombinasyonlar günlük, saatlik ve 15 dakikalık grafikleri içerir.
- Görüntüleme Seçenekleri: Yatırımcılar, grafikte hangi RSI çizgilerinin ve ortalama çizginin görüntüleneceğini seçebilir, bu da bilgi görselleştirmede esneklik sağlar.
Diğer Göstergelerle Birleştirme
3TF RSI Ortalaması momentum ve potansiyel geri dönüşler hakkında değerli bilgiler sağlasa da başarılı işlemleri garanti etmez. Bunu hareketli ortalamalar, trend çizgileri ve destek/direnç seviyeleri gibi diğer teknik göstergelerle birleştirmek, piyasaya daha kapsamlı bir bakış sunabilir ve karar verme sürecinizi güçlendirebilir.
Risk Yönetimi
Herhangi bir ticaret stratejisi için uygun risk yönetimi uygulamalarının kullanılması şarttır. Buna potansiyel kayıpları sınırlamak için zararı durdur emirlerinin kullanılması, çeşitlendirilmiş bir portföyün sürdürülmesi ve iyi tanımlanmış bir ticaret planına bağlı kalınması dahildir.
Gelişmiş Teknikler ve Hususlar
3TF RSI Ortalama MT5 Göstergesini kullanımlarını geliştirmek isteyen deneyimli yatırımcılar için dikkate alınması gereken bazı gelişmiş teknikler şunlardır:
Diverjanstan Faydalanmak
Daha önce de belirtildiği gibi, farklı zaman dilimlerindeki RSI değerleri arasındaki farklılıklar, potansiyel trend dönüşlerinin sinyalini verebilir. Tarihsel grafikleri incelemek ve bu tür farklılıklarda yinelenen kalıpları belirlemek, piyasadaki değişimleri tahmin etme yeteneğinizi geliştirebilir.
Dinamik Aşırı Alım/Aşırı Satış Seviyeleri
70 ve 30 gibi geleneksel seviyeler yaygın olarak kullanılırken, bazı yatırımcılar bu seviyeleri varlığın volatilitesine ve ortalama gerçek aralığa (ATR) göre dinamik olarak ayarlamayı araştırıyor. Bu, göstergenin farklı piyasa koşullarına uyarlanmasına yardımcı olabilir.
Sınırlamalar ve Dikkat Edilecek Noktalar
3TF RSI Ortalama MT5 Göstergesi umut verici işlevler sunarken, sınırlamalarını ve potansiyel tuzaklarını kabul etmek çok önemlidir:
- Gösterge Sinyallerine Aşırı Güvenme: 3TF RSI Ortalaması dahil hiçbir gösterge kârlı işlemleri garanti edemez. Gösterge sinyallerini diğer faktörleri dikkate almadan körü körüne takip etmek önemli kayıplara yol açabilir.
- Yanlış Sinyaller ve Piyasa Gürültüsü: Gösterge, piyasa oynaklığı, haber olayları ve beklenmedik fiyat hareketleri gibi faktörler nedeniyle yanlış sinyaller üretebilir. Gürültüyü filtrelemek ve göstergenin içgörülerini diğer teknik ve temel analiz teknikleriyle birleştirmek çok önemlidir.
- Büyük Resme Odaklanın: 3TF RSI Ortalaması öncelikle piyasanın teknik yönlerine odaklanır. Ekonomik veriler, sektör haberleri ve küresel olaylar gibi temel faktörlerin piyasa hareketlerini önemli ölçüde etkilediğini unutmamak önemlidir. Bu daha geniş faktörlerin göz ardı edilmesi, gösterge sinyallerinin çarpık yorumlanmasına yol açabilir.
3TF RSI Ortalama Göstergesi ile Nasıl Ticaret Yapılır?
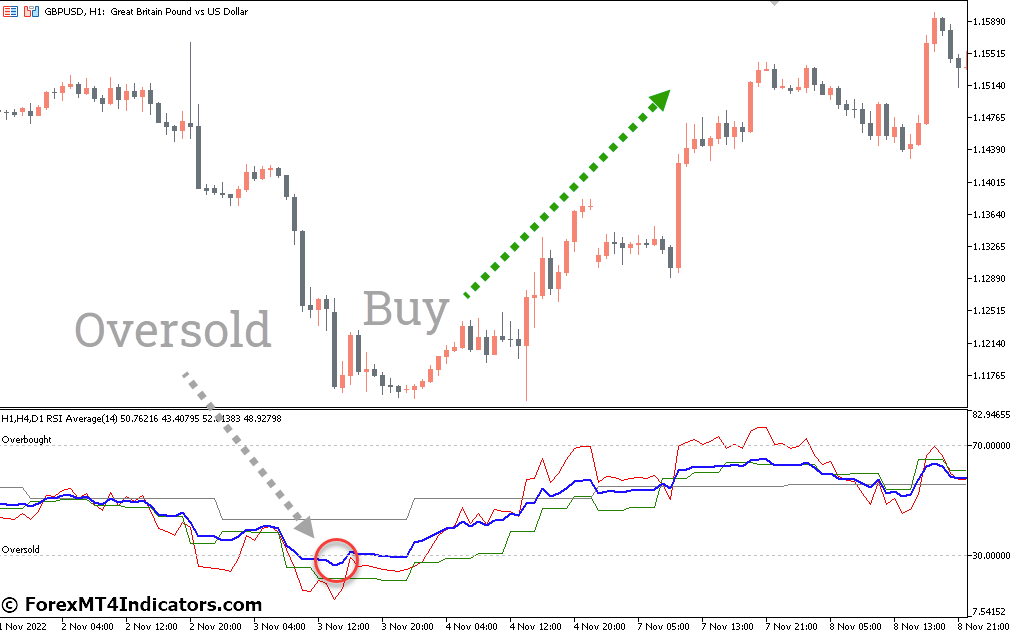
Giriş Satın Al
- Ortalama RSI 30'un altına düşüyor: Bu, birden fazla zaman diliminde aşırı satış koşullarını akla getiriyor.
- Farklı zaman dilimlerindeki bireysel RSI çizgileri ortalama çizgiye doğru yaklaşmaya başlar: Bu, momentumun potansiyel olarak tersine döndüğünü gösterir.
- Fiyat hareketi yükseliş eğiliminin tersine döndüğüne dair işaretler gösteriyor: Çekiç, yükseliş eğilimi veya pin çubukları gibi mum çubuğu modellerinden onay arayın.
- Son düşük seviyenin biraz üzerinde uzun bir pozisyon girmeyi düşünün.
- Son düşük seviyenin veya önemli bir destek seviyesinin altına bir zararı durdurma emri yerleştirin.
- Risk-getiri oranınıza ve teknik analizinize göre bir kâr düzeyi hedefleyin. Fiyat lehinize hareket ettikçe karı sabitlemek için takip eden zararı durdurma emirlerini kullanmayı düşünün.
Satış Girişi
- Ortalama RSI 70'in üzerine çıkıyor: Bu aşırı alım koşullarını ifade eder.
- Farklı zaman dilimlerindeki bireysel RSI çizgileri, ortalama çizgiden yukarı doğru sapmaya başlar: Bu, yükseliş momentumunun zayıfladığını gösterebilir.
- Fiyat hareketi düşüş eğiliminin tersine döndüğüne dair işaretler gösteriyor: Kayan yıldız, düşüş eğilimi veya asılı adam gibi mum çubuğu modellerinden onay arayın.
- Son salınım zirvesinin biraz altında bir kısa pozisyon girmeyi düşünün.
- Son yükselişin en yüksek seviyesinin veya önemli bir direnç seviyesinin üzerine bir zararı durdurma emri verin.
- Risk-getiri oranınıza ve teknik analizinize göre bir kâr düzeyi hedefleyin. Fiyat lehinize hareket ettikçe karı sabitlemek için takip eden zararı durdurma emirlerini kullanmayı düşünün.
3TF RSI Ortalama Gösterge Ayarları
Sonuç
3TF RSI Ortalama MT5 Göstergesi, teknik analistler için değerli bir araç sunarak birden fazla zaman diliminde momentum, potansiyel geri dönüşler ve aşırı alım/aşırı satım koşullarına ilişkin bilgiler sunar. 3TF RSI Ortalama MT5 Göstergesinin yeteneklerini ve sınırlamalarını anladıktan, onu kapsamlı bir ticaret stratejisine entegre ettikten ve sürekli öğrenmeye öncelik verdikten sonra, finansal ticaretin dinamik dünyasında daha büyük bir güvenle ve bilinçli kararlarla gezinmek için kendinizi bilgi ve becerilerle donatabilirsiniz. -yapımı.
Önerilen MT5 Komisyoncuları
XM Broker
- Ücretsiz $ 50 Anında Ticarete Başlamak için! (Çekilebilir Kar)
- Para Yatırma Bonusu $5,000
- Sınırsız Sadakat Programı
- Ödüllü Forex Brokerı
- Ek Özel Bonuslar Yıl boyunca

>> XM Broker Hesabına buradan kaydolun <
FBS Aracısı
- Ticaret 100 Bonus: Ticaret yolculuğunuza başlamak için ücretsiz 100$!
- 100% Depozito: Yatırdığınız parayı 10,000$'a kadar ikiye katlayın ve artırılmış sermayeyle işlem yapın.
- 1'e kadar kaldıraç: 3000: Mevcut en yüksek kaldıraç seçeneklerinden biriyle potansiyel kârı en üst düzeye çıkarmak.
- 'Asya'nın En İyi Müşteri Hizmetleri Komisyoncusu' Ödülü: Müşteri desteği ve hizmetinde tanınan mükemmellik.
- Mevsimsel Promosyonlar: Tüm yıl boyunca çeşitli özel bonusların ve promosyon tekliflerinin keyfini çıkarın.

>> FBS Broker Hesabına buradan kaydolun <

(Ücretsiz MT5 Göstergeleri İndir)
İndirmek için aşağıya tıklayın: