


Supported 123 Drive Forex Trading Strategy
Support and resistances are one of the most basic ways to trade the forex markets, or any trading market for that matter. Many traders, when they first come in to trading, this is one of the first things they learn. Then, as for most cases, they experience some difficulty as they first start out learning the craft of trading supports and resistances. So, they move on to the next shiny thing that catches their attention. Little do they know, if they just kept on practicing that simple craft, they would have mastered it sooner and would have been profitable a whole lot sooner.
Elliott Wave Theory
According to the Elliott Wave Theory the collective market psychology often moves in a predictable sequence. The investing or trading crowd often moves from bullish sentiment to bearish sentiment and back again in a series of drives and pullbacks, which according to the theory, could be counted. Below is the classic Elliott Wave pattern that could be observed often in the market.
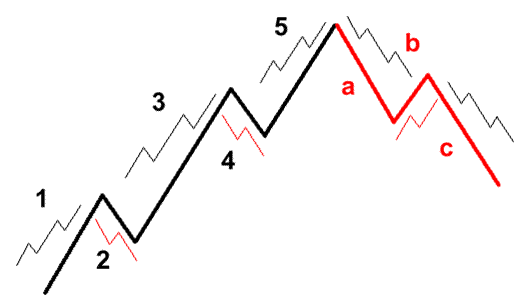
In this pattern, you would notice how the market often moves in a series of drives, then a pullback, followed by another strong drive, then a pullback, then the final drive, before the sentiment shifts. Now, although I’m not saying that this is the rule of thumb on how the market moves, but this does recur often in the markets, though not as perfect as this one.
Support and Resistance Channels
As said earlier, many beginning traders, when they first start out on technical analysis, would learn support and resistances, channels, and whatnot. However, the more obvious support and resistances, and channels are the ones that are fully developed. If you would layer these supports and resistances on the picture above, you would notice that the channel is observable often on move number five, which is in theory often the last drive before the reversal.
So, here comes a trader who just learned channels, supports and resistances. They see this fully developed channel which respects the support and resistance they’ve drawn. Then they think to themselves it is a sure thing. How can it go wrong? Every time price touched that support, it just bounces off. So, as soon as price starts to retrace to the support line, they enter the trade. Little did they know, it was move “a”. It was the beginning of the end. They get stopped out and lose. Then they think to themselves, it was a sure thing. Why did the market reverse as soon as I entered that trade? They’d feel betrayed by the market not knowing that the market was just doing its thing.
Trading Strategy Concept
Based on the hypothetical graph above, where should we take the trade? Definitely not after drive 1 and 3, what comes after those are pullbacks. You wouldn’t want to take a trade that goes against the general trend of the market. Right after number 2? Maybe, after all, move 3 is usually the strongest drive of this pattern. Maybe, if you have a way to predict it was going to be a bullish channel.
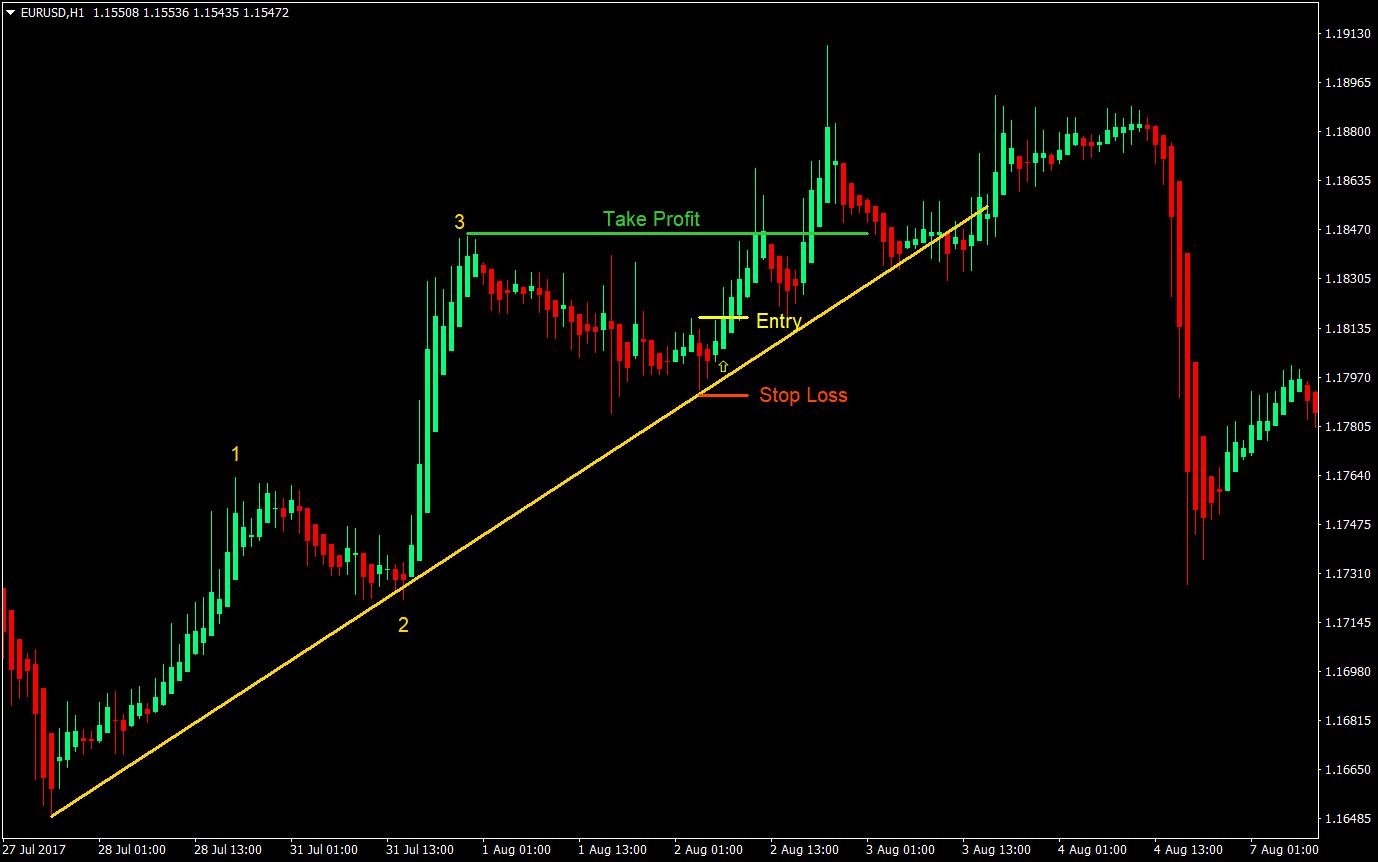
With this strategy however, we would take the trade only on the fourth move, which is probably the last drive. This way, we already have an idea that the market is on a bullish trend because of the higher high made by move 3 and we also get to draw the support line by connecting the base of move 1 and the retrace on move 2, then extend it further to anticipate where price could bounce off from.
So, we observe the charts. Identify if the market has a strong first drive, a pullback, then another drive. We connect and extend the base of move 1 and move 3 to draw the support line. Then we wait.
However, although doing this on a naked chart is feasible, even very profitable, it wouldn’t hurt if we would add another confirmation to identify our entry. This strategy utilizes the Heiken Ashi candle sticks. This way we could observe if price has already touched the support line and is already bouncing off it as the Heiken Ashi candle changes color. As soon as the Heiken Ashi candle changes color, we place our pending stop entry order at the high of that candle and wait to be filled, then let the magic happen.
Indicators: Heiken Ashi
Timeframe: preferably 15-min, 1-hour, 4-hour and daily charts
Currency Pair: any
Trading Session: any
Trade Setup
Entry
- Identify the initial phase of the Elliott Wave pattern, which is move 1 to 3
- Draw the support line by connecting the base of the drives
- Wait for price to revisit and touch the support line
- Wait for the Heiken Ashi candle to turn green
- As soon as the Heiken Ashi candle turns green, place a buy stop order at the high of the candle and let the market fill the order
Stop Loss
- Set the stop loss a few pips below the candle that touched the support line
Take Profit
- Set the take profit target at the high of move 3
Conclusion
Without the Heiken Ashi candles as the trigger for setting up the trade, this would have been the classical channel trading. The only difference would be that this time around, we are aware that the market has a higher probability of reversing after the third drive.
Now, as said earlier, this is not a rule of thumb. Even if the theory predicts only three drives, nothing could stop the market from making a fourth, fifth or even sixth drive if it wants to. As you would notice, the first example did have quite a move before the market actually reversed. If you’d want to be a bit more aggressive and squeeze out a few more pips from the market, you could have some modifications which could include some scaling out or a trigger to exit the market if it starts to reverse after the last drive.
Recommended MT4 Broker
- Free $50 To Start Trading Instantly! (Withdrawable Profit)
- Deposit Bonus up to $5,000
- Unlimited Loyalty Program
- Award Winning Forex Broker
- Additional Exclusive Bonuses Throughout The Year

>> Claim Your $50 Bonus Here <<
Click here below to download: