


“Trade with the trend!” You would often hear this motto from many seasoned traders, and this is for a reason. Many professional traders would often want to take trades with the trend because it is easier to trade with the flow of the market rather than against it.
Imagine yourself rowing upstream in a kayak. If the current is strong, chances are you have a really hard time reaching where you would want to go because you are fighting against the current. Now, imagine yourself rowing on the same river in a kayak, but this time you are heading downstream. That would be much easier, right? That is because you are traveling with the flow of the river. The same is true with trading. It is much easier to trade in the direction of the flow of the market rather than against it. Price has a better chance of traveling in the direction of your trade and tend to move farther away from your entry price, giving you a chance for a big fat profit. This is what trend following trading strategies is all about.
Rainbow Moving Average Forex Trading Strategy is a trend following strategy that helps traders identify the direction of fast-moving trends and help them trade accordingly. Not only that, it also allows traders to pinpoint the exact entry and exit points for better profits.
Rainbow MMA
Rainbow MMA is a custom technical indicator based on moving averages. It is basically an indicator that uses multiple Exponential Moving Averages (EMA) that are stacked on top of each other.
It has a total of six moving average lines. There are four moving average lines that are colored sky blue and two moving average lines that are gold. The sky blue moving average lines have a relatively longer period and represents the longer-term trends, while the gold moving average lines have shorter periods and represent the shorter-term trends. However, all in all, this set of moving averages tend to work best for the short-term trends. It is very responsive to trend changes and works best whenever the market is in a very strong trend.
To use this indicator, we should be looking at how the lines are stacked. The gold lines are on top of the sky-blue lines during an uptrend. However, during a downtrend the gold lines are stacked below the sky-blue lines. Strong trends also tend to cause the moving average lines to fan out, while weak trends tend to have a contracted set of moving average lines.
HMA Indicator
The HMA indicator is a custom indicator that is based on the Hull Moving Average (HMA).
It is a moving average, which instead of being plotted as a line, is plotted as dots. The dots change color whenever the slope of the dots shift indicating a shift in trend direction. Light blue dots indicate a bullish trend while tomato colored dots indicate a bearish trend.
This custom moving average is an extremely fast moving average yet it at the same time is very smooth. This gives traders a moving average line that is very responsive to trend changes, yet at the same time provides less false signals compared to other moving average signals.
Trading Strategy
This strategy is best used in strong trending markets which is trending on the short to mid-term trends.
To trade this strategy, we will be looking at how the Rainbow MMA is stacked to identify trend direction and strength. We would want to take trades in the direction of the trend as indicated by the Rainbow MMA based on where the gold lines are in relation to the sky-blue lines. We would also prefer trades on markets which cause the Rainbow MMA lines to widen as this is indicative of a strong trending market.
The HMA indicator dots should also agree with the trend direction of the Rainbow MMA indicator based on the color of the dots.
Then, we wait for price to retrace towards the Rainbow MMA lines. As price retraces, the HMA dots should temporarily change color. The Rainbow MMA lines should act as a dynamic area of support or resistance and cause price action to show signs of price rejection of the area.
As the trend direction resumes, price action would start to pull away from the Rainbow MMA lines. We then take the trade as soon as the HMA dots change color resuming the direction of the trend.
Indicators:
- HMA_v2 (default setting)
- RainbowMMA_09 (default setting)
Preferred Time Frames: 1-hour, 4-hour and daily charts
Currency Pairs: major and minor pairs
Trading Sessions: Tokyo, London and New York sessions
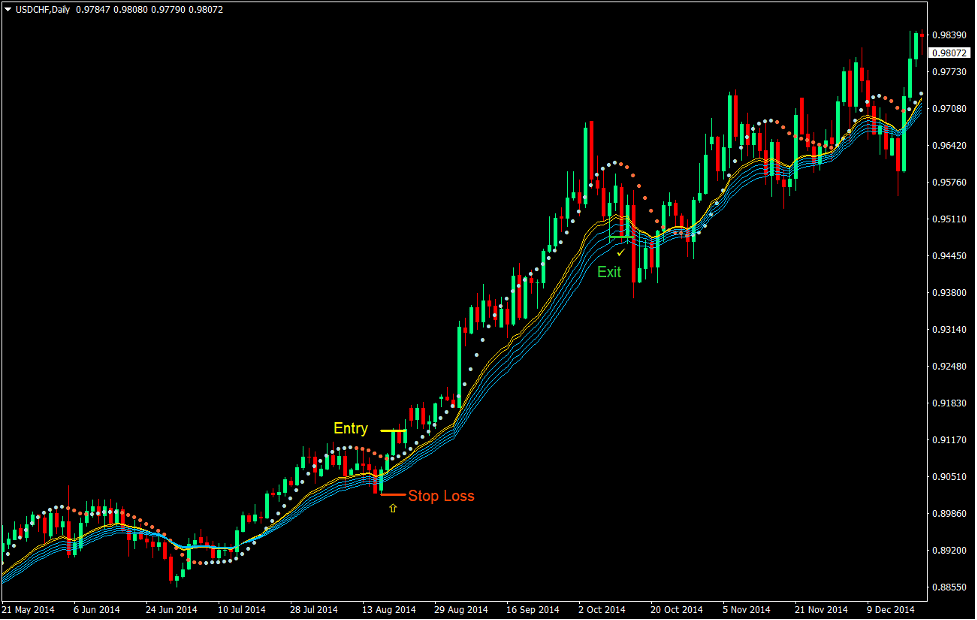
Buy Trade Setup
Entry
- The Rainbow MMA lines should be stacked with the gold lines being above the sky-blue lines.
- The HMA dots should be above the Rainbow MMA lines.
- The HAM dots should be color light blue.
- Price should visually be in an uptrend.
- Price should retrace towards the Rainbow MMA lines causing the HMA dots to temporarily change to color tomato.
- The Rainbow MMA lines should act as a dynamic support
- Enter a buy order as soon as the HMA dots change to light blue.
Stop Loss
- Set the stop loss at the fractal below the entry candle.
Exit
- Close the trade as soon as the HMA dots change to color tomato.
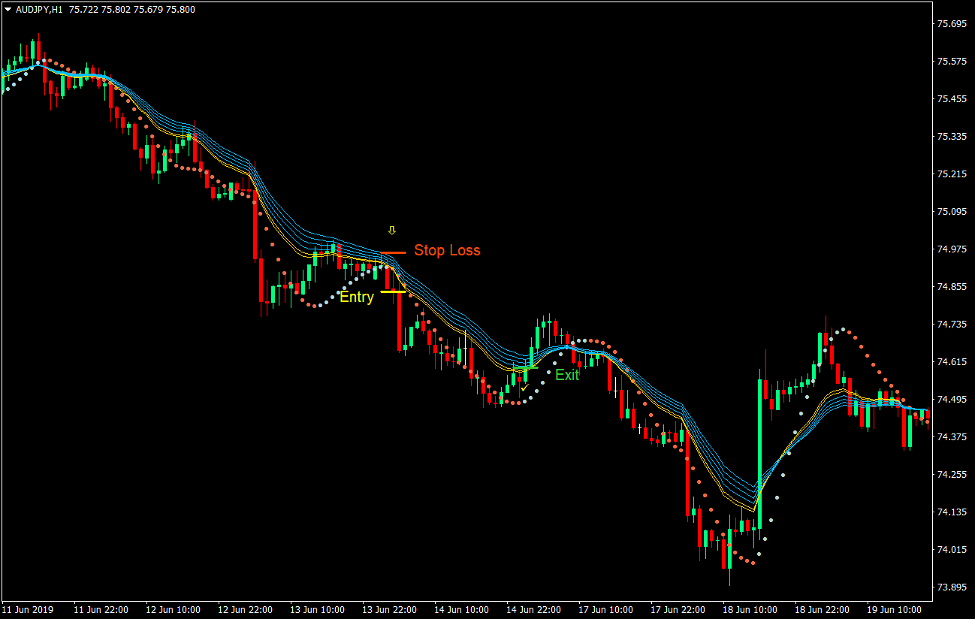
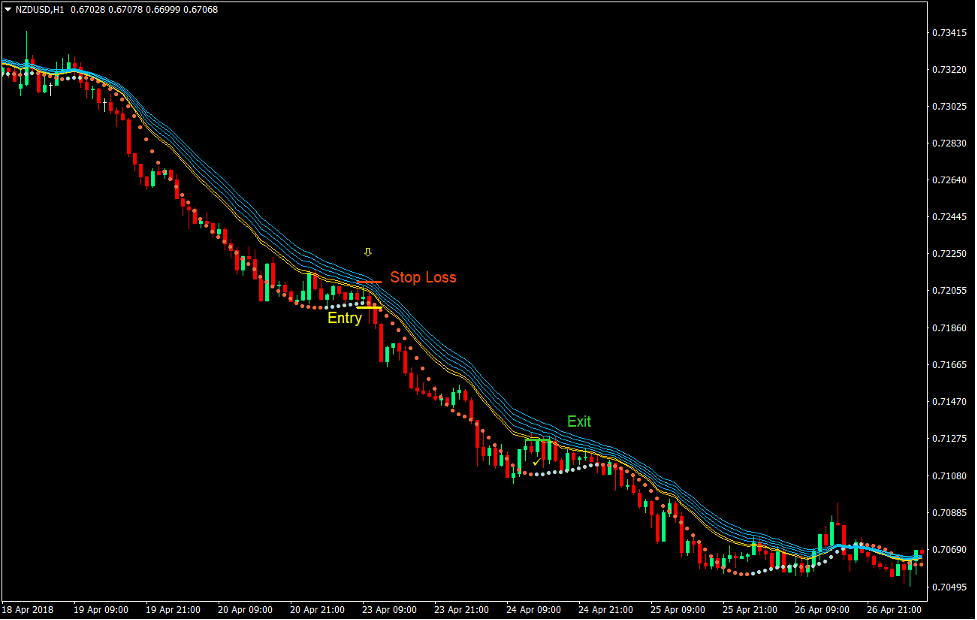
Sell Trade Setup
Entry
- The Rainbow MMA lines should be stacked with the gold lines being below the sky-blue lines.
- The HMA dots should be below the Rainbow MMA lines.
- The HAM dots should be color tomato.
- Price should visually be in a downtrend.
- Price should retrace towards the Rainbow MMA lines causing the HMA dots to temporarily change to color light blue.
- The Rainbow MMA lines should act as a dynamic resistance
- Enter a sell order as soon as the HMA dots change to color tomato.
Stop Loss
- Set the stop loss at the fractal above the entry candle.
Exit
- Close the trade as soon as the HMA dots change to light blue.
Conclusion
This strategy is very effective when used in a market that trending very strongly. It allows traders to ride the short bursts of the trend and exit as price starts to retrace. This gives traders a good win rate and high reward-risk ratios.
However, traders who would want to use this strategy should learn when to use this strategy and when not to. If the market tends to be respecting the Rainbow MMA as a dynamic support or resistance, then this strategy could work well. However, even if the market is trending if price is breaching the Rainbow MMA lines, this strategy would not be as effective because it indicates that the momentum of the trend is not strong enough. Also, avoid using this strategy when the entry available might be near the end wave of a trend. Momentum tends to fizzle out which makes trading a bit more difficult.
Practice this strategy and get a feel when to use it and you could be making consistent profits from the market.
Recommended MT4 Brokers
XM Broker
- Free $50 To Start Trading Instantly! (Withdraw-able Profit)
- Deposit Bonus up to $5,000
- Unlimited Loyalty Program
- Award Winning Forex Broker
- Additional Exclusive Bonuses Throughout The Year

>> Sign Up for XM Broker Account here <<
FBS Broker
- Trade 100 Bonus: Free $100 to kickstart your trading journey!
- 100% Deposit Bonus: Double your deposit up to $10,000 and trade with enhanced capital.
- Leverage up to 1:3000: Maximizing potential profits with one of the highest leverage options available.
- ‘Best Customer Service Broker Asia’ Award: Recognized excellence in customer support and service.
- Seasonal Promotions: Enjoy a variety of exclusive bonuses and promotional offers all year round.

>> Sign Up for FBS Broker Account here <<
Click here below to download: