


Many new traders have experienced beginner’s luck. They would try to dip their feet trading the forex markets and luckily on their first day trading their demo accounts they would experience a string of good trades. Then they come back the next day and have another string of good trades. Then the next day the same thing happens. So, they would start to think that forex trading is easy money. So, they open a real account and guess what, their lucky streak ends. They experience losses and swear that the forex market or the brokers are playing with them.
However, seasoned traders know that this all part of the game. Drawdowns do happen. The real test of a trader is how they weather these periods and be ready to catch the next string of good trades. Seasoned traders know that trading is all about probabilities. Traders that could either manage to win more often than they are losing or win bigger than they are losing could profit from the forex market over the long run.
One of the best ways to increase probabilities when trading the forex market is by looking for confluences. These are points in the market wherein several conditions indicate the same directional bias or reversal signal.
Metro Hull Reversal Forex Trading Strategy is a strategy that is hinged around this concept. It trades based on confluences coming from a couple of complementary indicators.
METRO Indicator
The METRO indicator is a custom technical indicator which helps traders identify the directional trend bias as well as potential trend reversals, which is based on an underlying Relative Strength Index (RSI).
The METRO indicator plots three lines. The orange line is a basic RSI line. The sky blue and magenta lines are also derived from the RSI line but have a ladder like characteristic. The sky-blue line moves faster compared to the magenta line.
Trend direction or bias is based on how these three lines interact. If the RSI line is generally above the magenta line while the sky-blue line stays above the magenta line, then the market has a bullish bias. On the other hand, the market has a bearish bias if the RSI line is generally below the magenta line while the sky-blue line stays below the magenta line.
Crossovers between the three lines are indicative of a trend reversal. An RSI line and the sky-blue line crossing above the magenta line indicates a possible bullish reversal. Inversely, an RSI line and the sky-blue line crossing below the magenta line indicates a possible bearish reversal.
Hull Trend
The Hull Trend indicator is another custom technical indicator which indicates short-term trends and momentum.
The Hull Trend indicator is based on the Hull Moving Average (HMA). Most moving average lines are too lagging and too susceptible to false signals coming from choppy markets. The Hull Moving Average is a modified moving average which places more emphasis on the most recent price movements making its moving average line characteristically more responsive to price action and yet is also very smooth.
The Hull Trend indicator on the other hand is not a moving average indicator. Instead it overlays bars on price action. These bars change color depending on the trend it detects from the underlying HMA line. Blue bars indicate a bullish momentum while red bars indicate a bearish momentum.
Trading Strategy
This trading strategy is a trend reversal strategy which provides trade setups based on the crossover of price action and a 50-period Exponential Moving Average (EMA) line. However, it also makes use of confluences coming from the METRO indicator and the Hull Trend indicator.
First, we observe the market for strong crossovers between price action and the 50 EMA line.
Then, we also observe the METRO indicator if the sky-blue line is also staying on the side of the magenta line which confirms the direction of the new trend.
We should then wait for price to retest the 50 EMA line then reject it.
The final entry trigger or confirmation will be a confluence between the RSI line crossing the sky-blue line in the direction of the trend and the changing of the color of Hull Trend bars.
Indicators:
- 50 EMA
- Hull Trend
- METRO
Preferred Time Frames: 15-minute, 30-minute, 1-hour, 4-hour and daily charts
Currency Pairs: FX majors, minors and crosses
Trading Sessions: Tokyo, London and New York sessions
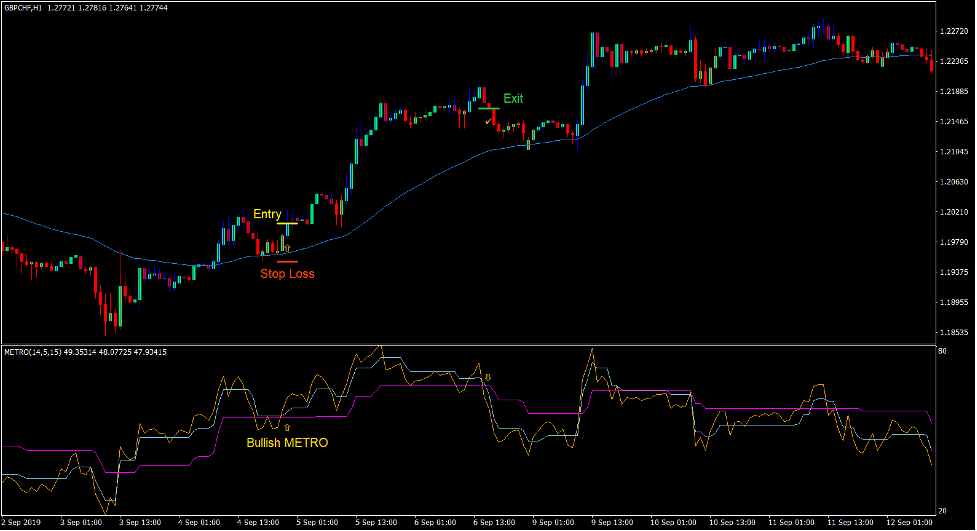
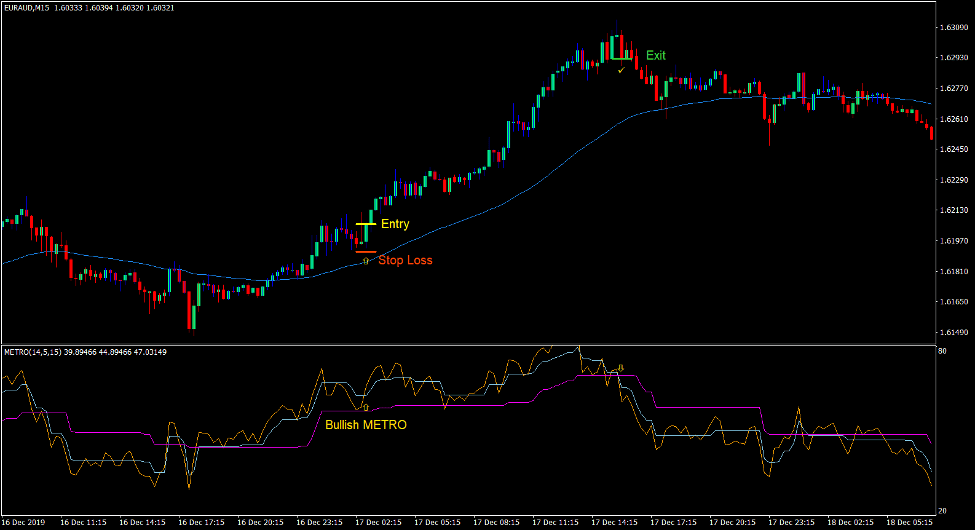
Buy Trade Setup
Entry
- Price action should cross above the 50 EMA line.
- The sky-blue line of the METRO indicator should generally be above the magenta line.
- Price should retrace towards the 50 EMA line then reject it.
- The RSI line of the METRO indicator should cross above the sky-blue line.
- The Hull Trend bars should change to blue.
- Enter a buy order on the confirmation of these conditions.
Stop Loss
- Set the stop loss on the support below the entry candle.
Exit
- Close the trade as soon as the sky-blue line of the METRO indicator crosses below the magenta line.
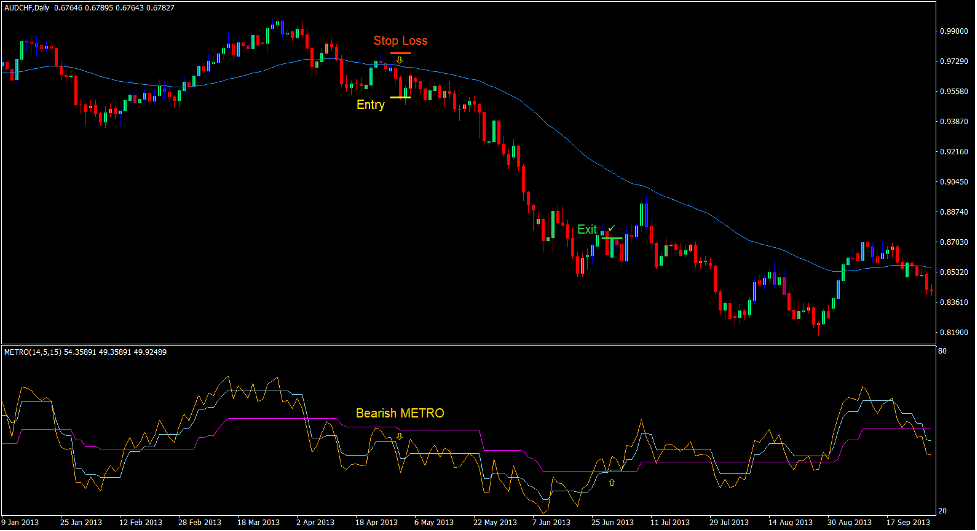
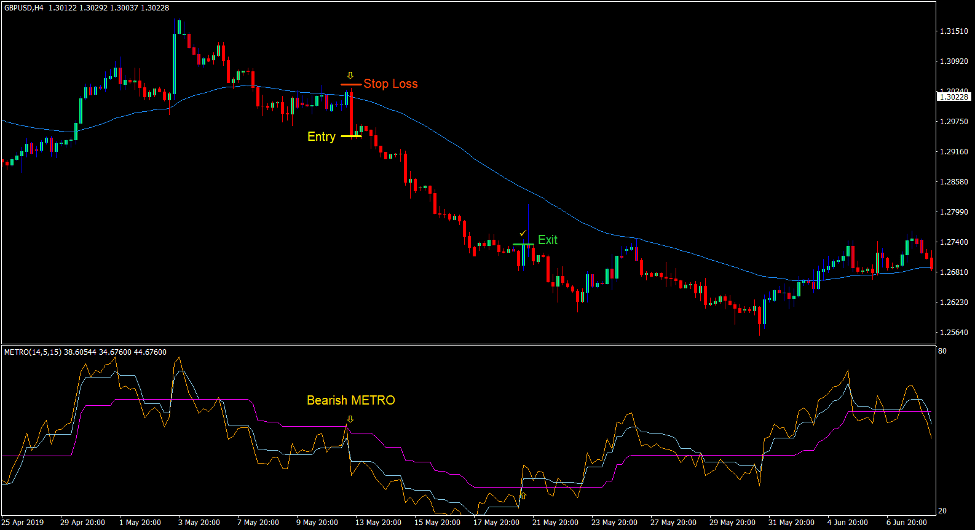
Sell Trade Setup
Entry
- Price action should cross below the 50 EMA line.
- The sky-blue line of the METRO indicator should generally be below the magenta line.
- Price should retrace towards the 50 EMA line then reject it.
- The RSI line of the METRO indicator should cross below the sky-blue line.
- The Hull Trend bars should change to red.
- Enter a sell order on the confirmation of these conditions.
Stop Loss
- Set the stop loss on the resistance above the entry candle.
Exit
- Close the trade as soon as the sky-blue line of the METRO indicator crosses above the magenta line.
Conclusion
This trading strategy is a simple trading strategy based on the crossover of price action and the 50 EMA line. Crossovers between price action and the 50 EMA line is a crucial turning point in the market which many traders look at. However, many traders also consider this point as the death cross since it could either mean a trend reversal or a fake-out.
This strategy however attempts to increase the probability of a winning trade by incorporating the concept of a retest and rejection based on price action characteristics, as well as confluences coming from two momentum and trend indicators.
Recommended MT4 Brokers
XM Broker
- Free $50 To Start Trading Instantly! (Withdraw-able Profit)
- Deposit Bonus up to $5,000
- Unlimited Loyalty Program
- Award Winning Forex Broker
- Additional Exclusive Bonuses Throughout The Year

>> Sign Up for XM Broker Account here <<
FBS Broker
- Trade 100 Bonus: Free $100 to kickstart your trading journey!
- 100% Deposit Bonus: Double your deposit up to $10,000 and trade with enhanced capital.
- Leverage up to 1:3000: Maximizing potential profits with one of the highest leverage options available.
- ‘Best Customer Service Broker Asia’ Award: Recognized excellence in customer support and service.
- Seasonal Promotions: Enjoy a variety of exclusive bonuses and promotional offers all year round.

>> Sign Up for FBS Broker Account here <<
Click here below to download: