


Dual Heiken Ashi Forex Trading Strategy
Heiken Ashi candles? What is it and how would it help us?
Heiken Ashi candles are partly candlesticks, and partly indicators. Just as the original candlesticks, the Heiken Ashi candlesticks also come from Japan. Heiken Ashi in Japanese basically means average bars. This is where the Heiken Ashi candles sets itself apart from the regular Japanese candlesticks.
Whereas the regular Japanese candlesticks are drawn based on a regular open, high, low, close method, the Heiken Ashi candles are drawn based on a formula derived from the open, high, low, and close. This method smoothens out the usual plotting of bars that we are familiar to. Instead of seeing a constantly changing candlestick color, what the Heiken Ashi candles present to us are candlesticks that change in color when there is an indication of a change in the short-term trend. This lessens the noise that often confuses us as traders.
Determining Trend through Heiken Ashi Smoothed Candles
Now that we have an idea what a regular Heiken Ashi candle is, let’s learn about its sibling, the Heiken Ashi Smoothed indicator.
Just like the regular Heiken Ashi candles, the Heiken Ashi Smoothed indicator is also based on a formula and is plotted like candles, with a wick and a body. However, their similarities end there.
Unlike the regular Heiken Ashi candles, the Heiken Ashi Smoothed indicator is less of a candlestick, and more of an Exponential Moving Average (EMA) indicator. It doesn’t show the highs and lows of a candle, in fact it is often printed a tad above or below the regular candlestick.
So, if the Heiken Ashi Smoothed indicator is more of an EMA, how should we be using it? We could use it just as we would use an EMA, not as a candlestick. We can’t determine price action with it, but just as an EMA, we could determine trend direction. Its advantage is that change in trend direction is easier to determine due to the color change that occurs on the Heiken Ashi Smoothed candles.
Trading Strategy Concept
Because the Heiken Ashi Smoothed indicator is an excellent indicator for trend direction, we will play to its strength. Looking at a Heiken Ashi Smoothed chart with regular settings, you would notice how clear trend changes are with it, with just minor false signals, just as below.
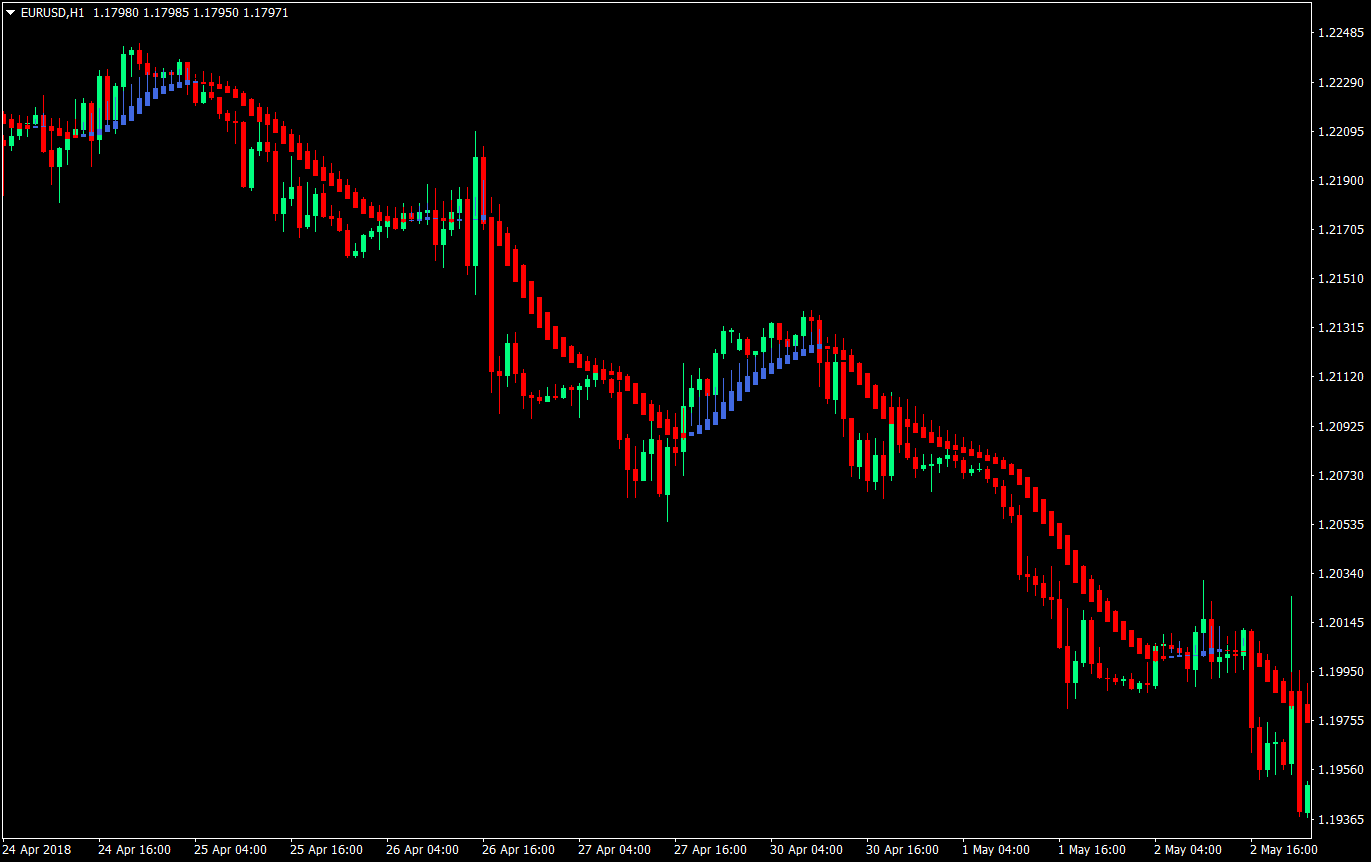
However, there are some small trend changes that are short lived. This is because it is going against a bigger trend. To determine the bigger trend, we will be adding another Heiken Ashi Smoothed indicator with a longer period. This will allow us to take trades that are not going against the main trend.
Indicators:
- Heiken_Ashi_Smoothed (fast parameters)
- MaMethod: 2
- MaPeriod: 6
- MaMethod2: 3
- MaPeriod2: 2
- Heiken_Ashi_Smoothed (slow parameters)
- MaMethod: 2
- MaPeriod: 50
- MaMethod2: 3
- MaPeriod2: 2
Timeframe: 1-hour or 4-hour chart
Currency Pair: any
Session: any
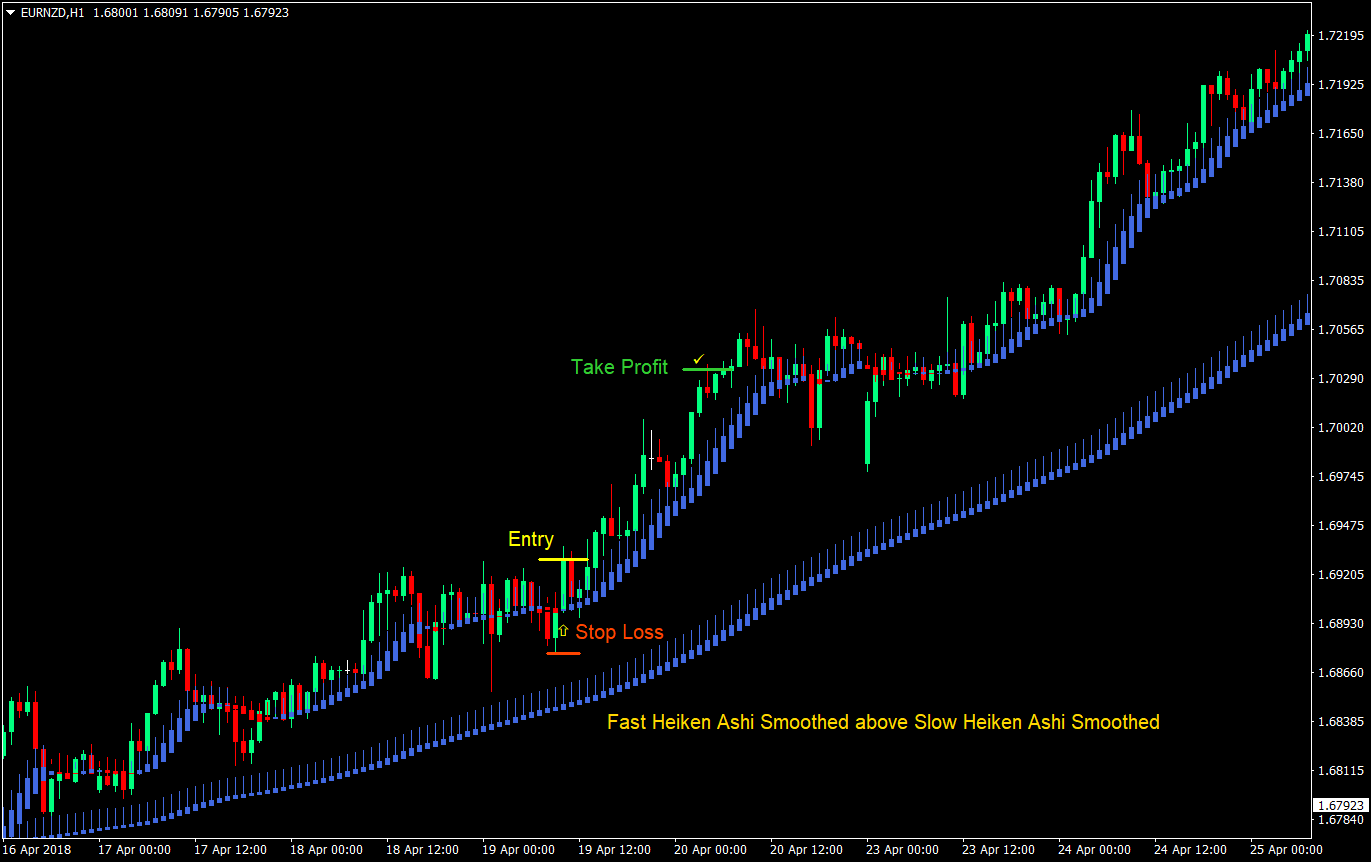
Buy (Long) Trade Setup Rules
Entry
- The fast Heiken Ashi Smoothed candles should be above the slow Heiken Ashi Smoothed candles
- Slow Heiken Ashi Smoothed candles should be color blue
- Enter on the color change of the fast Heiken Ashi Smoothed indicator from red to blue
Stop Loss
- Set the stop loss at the swing low or fractal below the entry candle
Take Profit
- Set the target take profit at 2x the risk on the stop loss
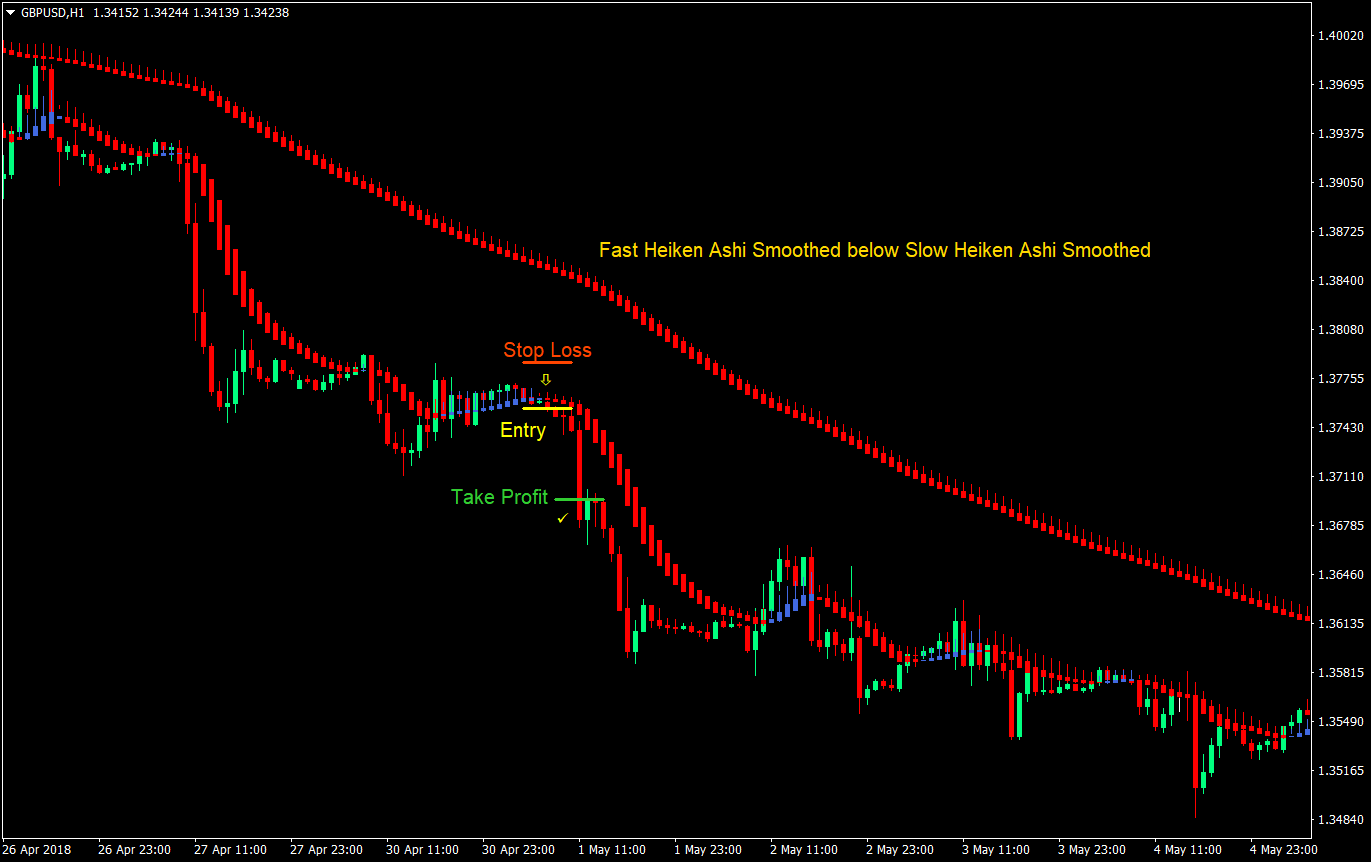
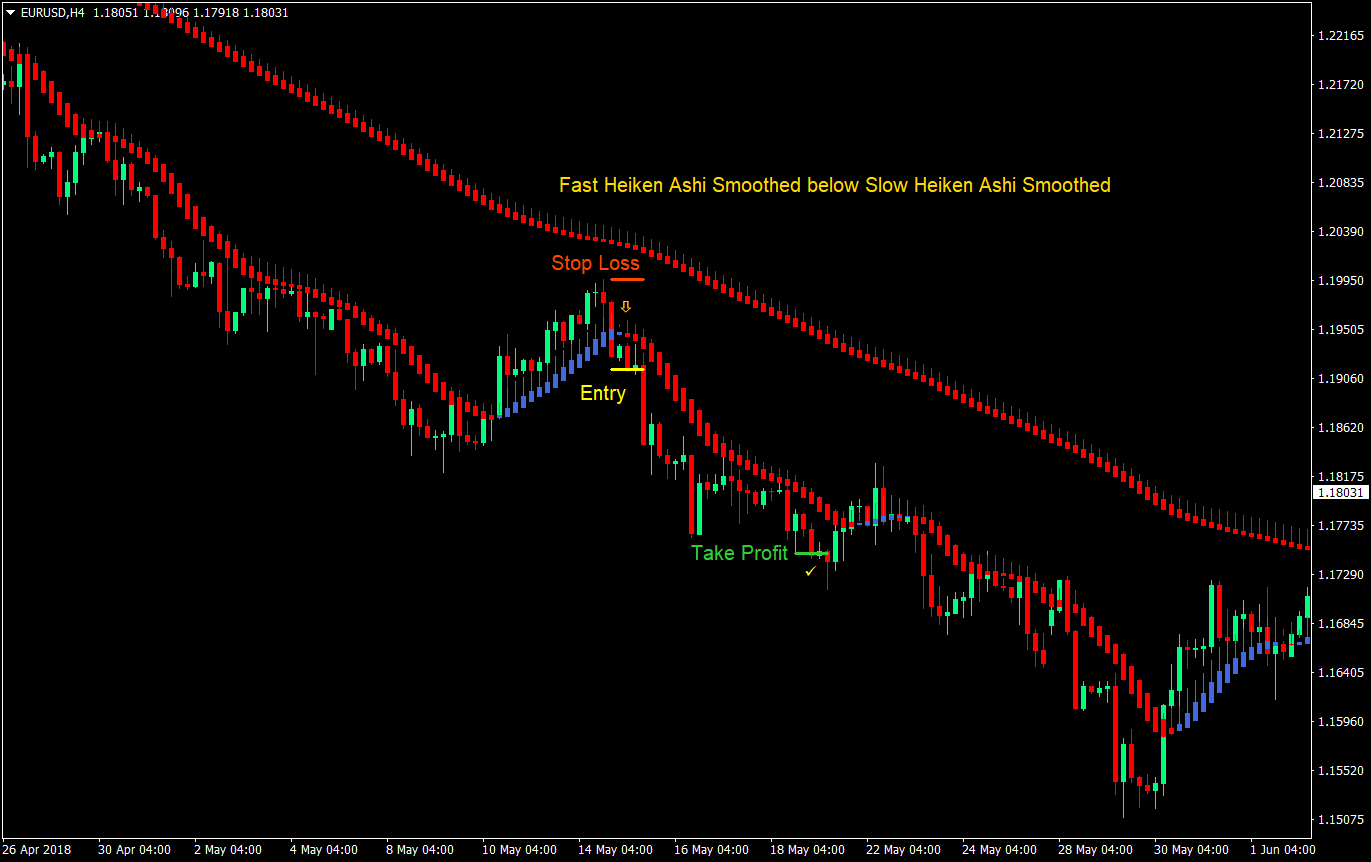
Sell (Short) Trade Setup Rules
Entry
- The fast Heiken Ashi Smoothed candles should be below the slow Heiken Ashi Smoothed candles
- Slow Heiken Ashi Smoothed candles should be color red
- Enter on the color change of the fast Heiken Ashi Smoothed indicator from blue to red
Stop Loss
- Set the stop loss at the swing high or fractal above the entry candle
Take Profit
- Set the target take profit at 2x the risk on the stop loss
Conclusion
This is a strategy that is based on a low noise indicator. As you would notice, the Heiken Ashi Smoothed indicator naturally has little noise, even with its standard parameters. It usually changes color only when the trend is changing. Adding the slower Heiken Ashi Smoothed indicator with a 50-period parameter allows us to filter out false signals even further.
There will be times when the color would change prior to the take profit target being reached. You could have several approaches on exiting trades. You could either stand your ground and not touch anything until either the stop loss or take profit target is reached. This could be done because there is a high chance that price would quickly go back towards the direction of your trend because of the bigger picture trend.
You could also employ a trailing stop loss behind the Heiken Ashi Smoothed candle. This would allow you to squeeze out moves for maximum gains during strongly trending market conditions. However, there will also be a high chance wherein the trailing stop loss would be hit prematurely during retracements.
Lastly, you could exit trades as the color changes. I wouldn’t recommend this though because it might cause some potentially profitable trades or trades that had been in profit to be closed at a loss.
Some traders who are used to price action and flow could use major support and resistances as targets. However, during strong trends, you could find yourself having no horizontal support or resistance as targets because price might have already wiped it out.
Tweak and test this strategy to your own liking and make it yours.
Recommended MT4 Broker
- Free $50 To Start Trading Instantly! (Withdrawable Profit)
- Deposit Bonus up to $5,000
- Unlimited Loyalty Program
- Award Winning Forex Broker
- Additional Exclusive Bonuses Throughout The Year

>> Claim Your $50 Bonus Here <<
Click here below to download: