


The market is often difficult to trade. It often chops around the price chart with seemingly no direction at all. But why is it that many traders could make money from the forex market with so much ease? How do they do it?
One of the techniques to trade the forex market profitably is to trade only when the market is easy to trade. In most cases, the market does seem to be very difficult to trade. Seasoned traders know that this is the perfect time to chill. They would rather stay on the sidelines rather than trade and risk losing their money. Instead, they would wait for the market to show clear signs of where it is going. This market condition is what we call a trending market. In this type of market, price would be steadily moving in one direction while having minor retracements towards the mean.
Now that we know when we should be trading, how do we trade it?
DSS Mod Trend Forex Trading Strategy is a strategy which is very effective during trending markets. It trades in the direction of the trend, yet it also waits for price to retrace deep enough and show signs that it is about to resume the trend.
Robby DSS Forex Indicator
Robby DSS Forex or DSS Mod is a custom technical indicator which identifies short-term overbought and oversold conditions, as well as trend reversals.
It is an oscillator which plots a line based on price movements within a range of -5 to 105. However, it is very seldom when the line would touch these figures. It has a marker at 5, 20, 80 and 95. Price is considered oversold whenever the line is between 5 and 20. On the other hand, price is considered overbought whenever the line is between 80 and 95.
The line also has dots placed on it. These dots change color whenever the slope of the line changes. These color changes could indicate a probable short-term reversal. Blue dots indicate a bullish slope, while red dots indicate a bearish slope.
Trading Strategy
This strategy is a simple trend following strategy which trades on deep retracements.
We will be using the 50-period Simple Moving Average (SMA) to identify trend direction. Trend direction will be based on the slope of the 50 SMA line. During a trending market the 50 SMA line would be steadily sloping up along with price. Price would also typically stay on one side of the 50 SMA line in the direction of the trend. On top of this, traders should also learn to visually identify a trending market based on the swing highs and swing lows to confirm if the market is indeed trending.
As soon as trend direction is confirmed, we could then wait for deep retracements towards the area near the 50 SMA line to take a trade. This would be accompanied by the DSS Mod line to fall within the oversold or overbought territory.
Trades are taken as soon as the color of the dots change, aligning with the trend direction indicated by the 50 SMA line. Price action should also show signs of price rejection or contraction. Price rejection is typically characterized by wicks pushing against the area near the 50 SMA line. Contraction on the other hand is characterized by small candles near the area of the 50 SMA line.
Indicators:
- 50 SMA (Gold)
- Robby DSS Forex (default setting)
Preferred Time Frames: 30-minute, 1-hour, 4-hour and daily charts
Currency Pairs: major and minor pairs
Trading Sessions: Tokyo, London and New York sessions
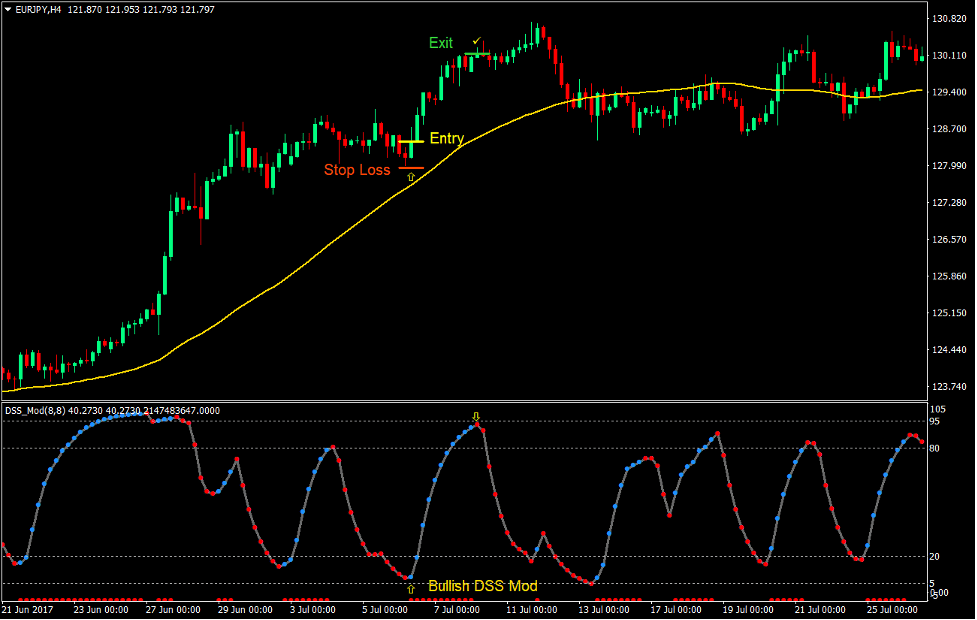
Buy Trade Setup
Entry
- Price should be above the 50 SMA line.
- The 50 SMA line should be sloping up.
- Price should retrace towards the area near the 50 SMA line.
- Price should show signs of price rejection or contraction as it nears the 50 SMA line.
- The DSS Mod line should be between 5 and 20.
- Enter a buy order as soon as the DSS Mod line changes to blue.
Stop Loss
- Set the stop loss on the fractal below the entry candle.
Exit
- Close the trade as soon as the DSS Mod line changes to red.
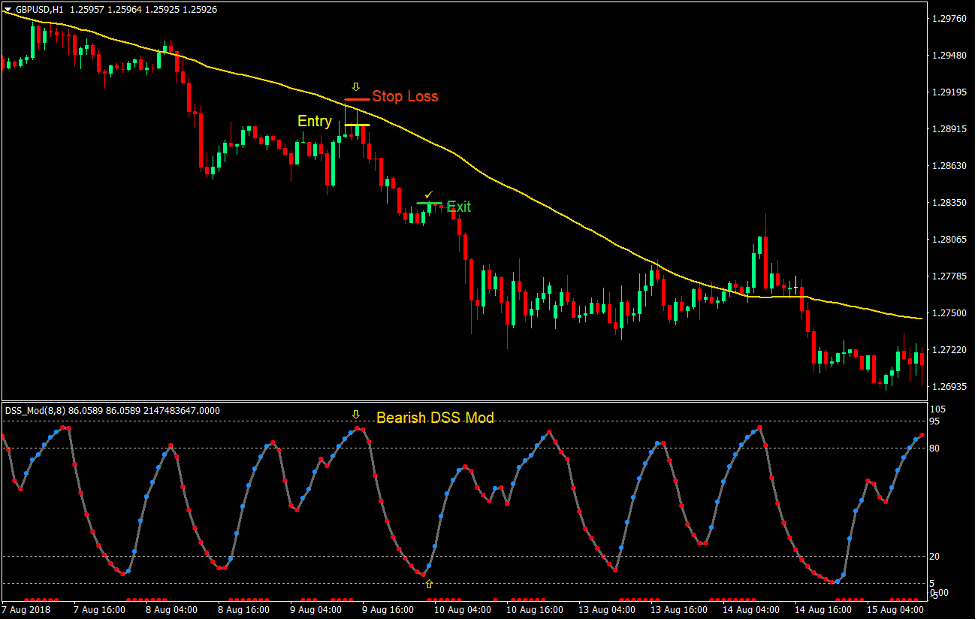
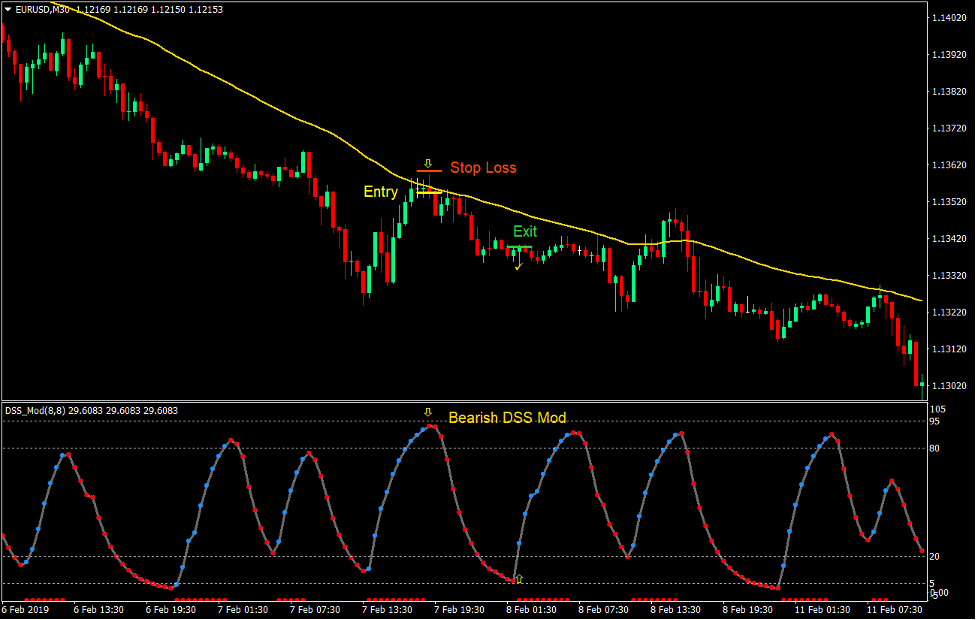
Sell Trade Setup
Entry
- Price should be below the 50 SMA line.
- The 50 SMA line should be sloping down.
- Price should retrace towards the area near the 50 SMA line.
- Price should show signs of price rejection or contraction as it nears the 50 SMA line.
- The DSS Mod line should be between 80 and 95.
- Enter a sell order as soon as the DSS Mod line changes to red.
Stop Loss
- Set the stop loss on the fractal above the entry candle.
Exit
- Close the trade as soon as the DSS Mod line changes to blue.
Conclusion
Trading on overbought or oversold territories while aligning with a bigger picture trend is one of the most effective ways to trade the market. This combines two strategies in one, a trend following strategy on the big picture and a mean reversal on the short-term.
This strategy allows for a high probability setup which could produce consistent profits. However, it is important to note that this strategy should be applied only during trending market conditions. Traders should also learn to observe for retracements, contractions and price rejections. Traders who could master anticipating these scenarios are the ones who could profit much from the market using this strategy.
Recommended MT4 Brokers
XM Broker
- Free $50 To Start Trading Instantly! (Withdraw-able Profit)
- Deposit Bonus up to $5,000
- Unlimited Loyalty Program
- Award Winning Forex Broker
- Additional Exclusive Bonuses Throughout The Year

>> Sign Up for XM Broker Account here <<
FBS Broker
- Trade 100 Bonus: Free $100 to kickstart your trading journey!
- 100% Deposit Bonus: Double your deposit up to $10,000 and trade with enhanced capital.
- Leverage up to 1:3000: Maximizing potential profits with one of the highest leverage options available.
- ‘Best Customer Service Broker Asia’ Award: Recognized excellence in customer support and service.
- Seasonal Promotions: Enjoy a variety of exclusive bonuses and promotional offers all year round.

>> Sign Up for FBS Broker Account here <<
Click here below to download: