


Japanese candlesticks have been one of the most revolutionary innovations in trading. In spite of its simplicity, Japanese candlesticks had so much impact in technical trading. In fact, most traders today use Japanese candlesticks as their charting style.
Japanese candlesticks are so effective as a charting method because it simplifies how traders view their price charts, while at the same time telling the story of how price moved. Basic bar charts may look like simple opens, closes, highs and lows of price movements. However, with Japanese candlesticks, price charts tell a story of how price pushed back and forth across the price range.
This method of looking at Japanese candlesticks and understanding the story of how price moved is best encapsulated with candlestick patterns.
Candlestick patterns are recurring patterns that are formed by candlesticks that indicate the next direction of price action. These patterns could tell traders whether price is reversing or continuing. It could also tell traders if price has momentum or the market is indecisive. It could indicate if price is rejecting a certain level or breaking out of it with momentum. All of this information are useful hints which traders may use to anticipate the next price movement.
Here we will be looking at how the pin bar, which is one of the simplest yet most popular and effective candlestick pattern, can be executed in relation with a trending market condition.
Pin Bar Indicator
The Pin Bar is probably one of the simplest candlestick pattern that traders may come across with. It is a candle composed of a small body with an extremely small wick on one end and a long wick on the other end. A good rule of thumb in identifying pin bar patterns is that the long wick should be 2/3 the size of the entire candle.
The long wick signifies price rejection. It shows that price did reach that level. However, it also shows that the market was quick to push price back to where the market opened, creating the long wick and the small body.
In spite of its simplicity, pin bar patterns are very effective. In fact, when used in the right support or resistance level or in confluence with another indicator, the pin bar can produce signals with very high win probability.
The Pin Bar indicator simplifies the method of identifying pin bar patterns. It simply plots an arrow pointing the pin bar and the direction of the pin bar pattern whenever it detects one. Traders can use this as an entry signal to help them enter a trade objectively.
MA Ribbon Filled 89-21
MA Ribbon filled 89-21 is a trend following technical indicator based on moving averages. It plots a pair of modified moving averages. The faster moving average line is set at 21 periods, while the slower moving average line is set at 89 periods. Thus the name 89-21.
The moving average lines can also be modified based on type, period and source of its computation, whether it is the open, close, high, low or median.
Trend direction is based on how the two lines are stacked. The indicator also shades the area between the two lines to indicate the direction of the trend.
The trend is bullish if the faster moving line is above the slower line and the area between the lines is shaded red. On the other hand, the trend is bearish if the faster line is below the slower line and the area between the lines is shaded lime.
Price action also tends to stay above the lines in a bullish trend, and below the lines in a bearish trend.
The lines also tend to slope in the direction of the slope with the occasional reversals on the faster line during retracements.
Trading Strategy
Simple Pin Bar Bounce Forex Trading Strategy is a simple trend following strategy which utilizes the MA Ribbon Filled 89-21 indicator and the Pin Bar indicator to help us identify trade setups.
The MAR Ribbon Filled 89-21 indicator is used to identify trend direction. Trend is based on how the two lines crossover and the color of the area between the two moving average lines.
The area between the two lines also act as a dynamic area of support or resistance.
Price should retrace towards this area.
Trade signals are generated as soon as the Pin Bar indicator plots an arrow pointing the direction of the trend. This indicates that price is about to bounce of the said area.
Indicators:
- MA ribbon filled.89.21
- Pinbar
Preferred Time Frames: 4-hour and daily charts
Currency Pairs: FX majors, minors and crosses
Trading Sessions: Tokyo, London and New York sessions
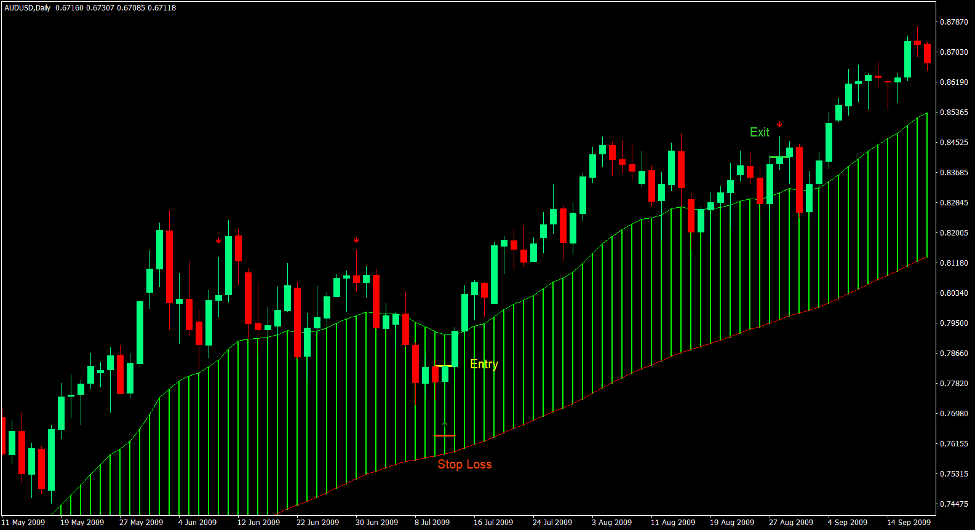
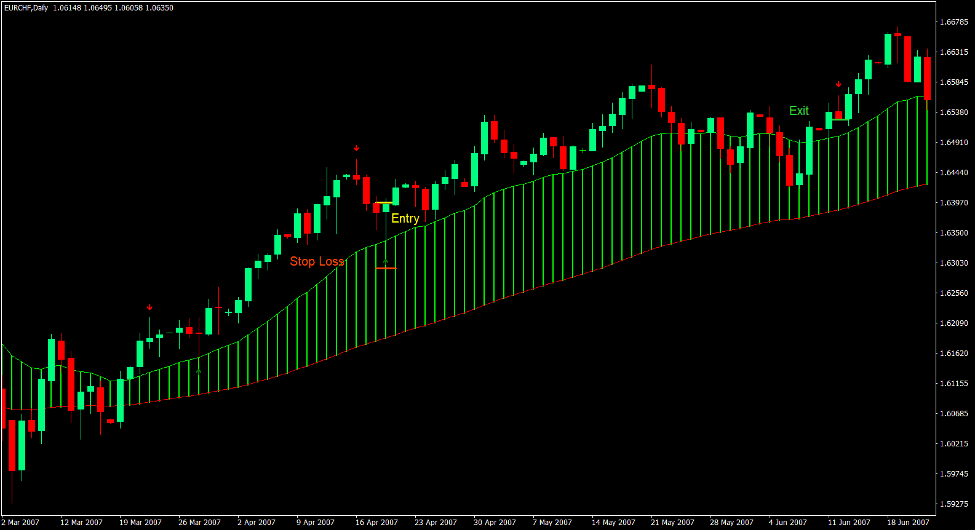
Buy Trade Setup
Entry
- The lime line of the MA Ribbon Filled 89-21 indicator should be above the red line.
- The area between the two lines should be lime.
- Price action should be bullish based on price swings.
- Price should retrace towards the area between the two lines.
- Enter a buy order as soon as the Pin Bar indicator plots an arrow pointing up.
Stop Loss
- Set the stop loss below the arrow.
Exit
- Close the trade as soon as the Pin Bar indicator plots an arrow pointing down.
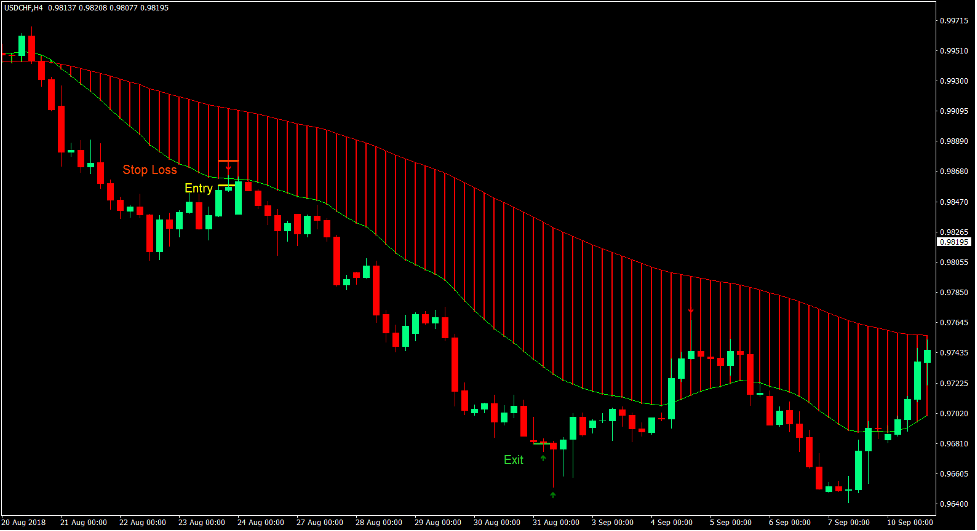
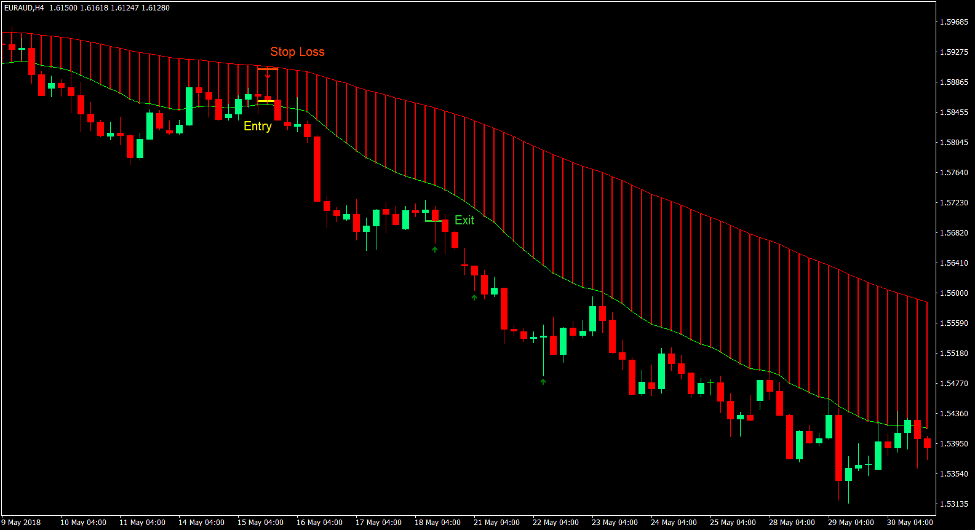
Sell Trade Setup
Entry
- The lime line of the MA Ribbon Filled 89-21 indicator should be below the red line.
- The area between the two lines should be red.
- Price action should be bearish based on price swings.
- Price should retrace towards the area between the two lines.
- Enter a sell order as soon as the Pin Bar indicator plots an arrow pointing down.
Stop Loss
- Set the stop loss above the arrow.
Exit
- Close the trade as soon as the Pin Bar indicator plots an arrow pointing up.
Conclusion
This strategy is a good example of how candlestick patterns can be used to identify the resumption of a trend in a trending market condition.
Pin bar patterns are excellent telltale signs of a reversal. It also works well in indicating the reversal of a short reversal.
Although this strategy has a very high probability of pointing the direction of price action in the near future, it could still produce some losing trades.
Losing trades are common whenever traders place tight stop losses using this strategy. However, if used with the right stop loss distance, the strategy tends to produce high quality trade setups that could produce profits consistently.
Recommended MT4 Brokers
XM Broker
- Free $50 To Start Trading Instantly! (Withdraw-able Profit)
- Deposit Bonus up to $5,000
- Unlimited Loyalty Program
- Award Winning Forex Broker
- Additional Exclusive Bonuses Throughout The Year

>> Sign Up for XM Broker Account here <<
FBS Broker
- Trade 100 Bonus: Free $100 to kickstart your trading journey!
- 100% Deposit Bonus: Double your deposit up to $10,000 and trade with enhanced capital.
- Leverage up to 1:3000: Maximizing potential profits with one of the highest leverage options available.
- ‘Best Customer Service Broker Asia’ Award: Recognized excellence in customer support and service.
- Seasonal Promotions: Enjoy a variety of exclusive bonuses and promotional offers all year round.

>> Sign Up for FBS Broker Account here <<
Click here below to download: