


One of the most effective form of breakout strategies are breakouts from a retracement or congestion. This is because retracements and congestions are a form of market contraction.
The market has two phases, one is an expansion phase and the other is a contraction phase. Markets cycle between these two phases alternately. Strong trends and momentum are associated with the expansion phase. During this phase, the market would move rapidly in one direction. Then, after the expansion phase, volume would usually drop as market participants either start to lock in profits and other traders would see price as either too high or too low. This leads to a gradual reversal. However, this reversal is usually not permanent. Often, as long as the long-term trend is in place, and the larger timeframe trends are not yet overextended, the market would often rebound and start another expansion phase going the same direction as the initial trend. This marks the end of the retracement or congestion, both of which are contraction phases.
What comes after the contraction phase is quite exciting as it would be another expansion phase. It is again a phase where strong one directional price movements occur, and momentum is strong. This phase presents opportunities to profit from the market. Traders who are able to enter at the start of this new momentum are often rewarded with huge gains.
The SAR Cloud Breakout Forex Trading Strategy is one which exploits this cycle. It trades on breakouts from retracement supports or resistances which are often the start of a strong momentum-based trend.
Forex Cloud
The Forex Cloud indicator is a custom indicator designed to identify the long-term trend and the area which could be considered as the mean of the trend.
This indicator marks the area of the mean price by shading the area. During a bullish trend, this indicator would be shading the area below price with lime dots. On the other hand, during a bearish trend, the shaded area is shifted above price and the dots are colored red. This represents the mean, as well as the dynamic support or resistance.
The indicator also draws a silver dotted line to represent the opposing support or resistance from the trend. During a ranging market, price would often bounce in between the shaded area and the dotted line. However, during a start of a momentum, price would breakout from the dotted line and start a new trend in the direction of the main trend as indicated by the color of the shaded area.
SAR Oscillator
The SAR Oscillator is a trend following indicator based on the Parabolic Stop and Reverse (SAR) indicator.
The SAR indicator is a staple indicator which is used by many traders as a trend indicator and as a basis for placing stop losses. The SAR indicator would place dots on the price chart based on the direction of the trend. On a bullish trend, dots are placed a certain distance below price, while on a bearish trend, the dots are placed above price. Stop losses can be placed beyond these points as trends are considered to be reversing whenever price breaches these points.
The SAR Oscillator on the other hand is based on the traditional SAR indicator. Instead of placing dots on the price chart itself, the indicator displays a histogram on a separate window. The histograms represent the distance between price and the dots. Positive histograms indicate a bullish trend while negative histograms indicate a bearish trend.
Trading Strategy
This strategy is a breakout strategy which is used to confirm breakouts from a retracement or congestion in an established long-term trend.
To trade this strategy, we must first identify the direction of the trend based on the shaded portion of the Forex Cloud indicator. Then, we wait for a retracement towards the shaded area, which is the dynamic area of support or resistance. As price retraces to this area, an opposing diagonal support or resistance would usually be established due to the gradual retracement or congestion. Trades are taken based on the breakout of these support or resistance lines. However, the opposing dynamic support or resistance line of the Forex Cloud indicator would also be used as the main breakout point. Price should close beyond the Forex Cloud indicator’s dotted silver line to confirm the breakout.
In addition to the Forex Cloud indicator, the SAR Oscillator should also confirm the trend reversal. The trend indicated by the SAR Oscillator should agree with the direction of the breakout.
Indicator:
- ForexCloud
- TimeFrame: H4
- SAR_oscillator
- Pas: 0.005
Preferred Time Frame: 15-minute chart
Currency Pairs: major and minor pairs
Trading Session: Tokyo, London and New York
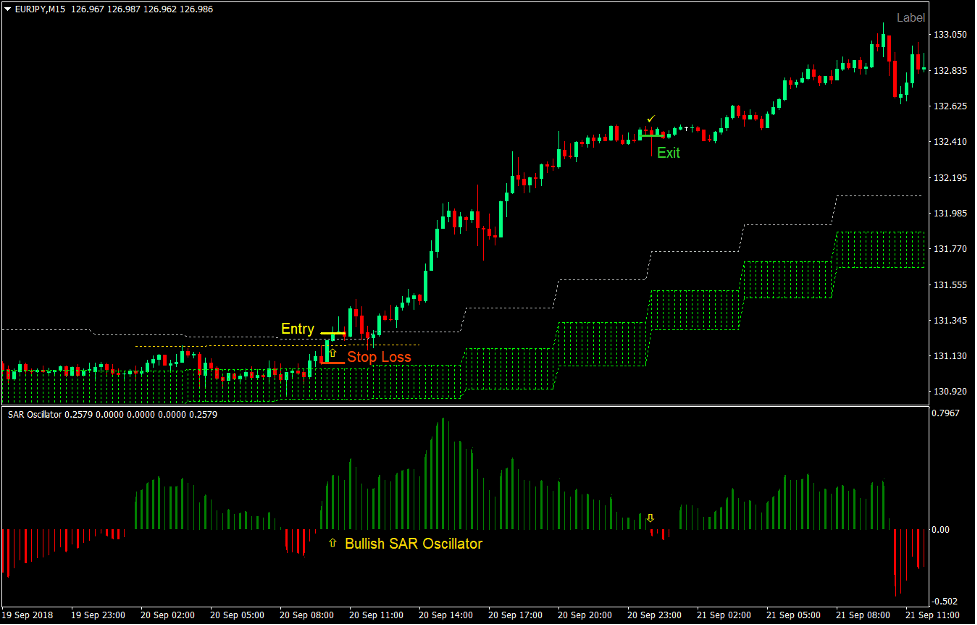
Buy Trade Setup
Entry
- The Forex Cloud indicator should display a lime shaded area below price indicating a bullish long-term trend.
- Price should retrace towards the lime shaded area.
- A diagonal or horizontal resistance line should be observable.
- Price should break above the resistance line.
- Price should break above the dotted silver line of the Forex Cloud indicator.
- The SAR Oscillator bars should become positive indicating a bullish trend reversal.
- These bullish signals should be closely aligned.
- Enter a buy order on the close of the candle breaking above the silver dotted line.
Stop Loss
- Set the stop loss on the top edge of the lime shaded area of the Forex Cloud indicator.
Exit
- Close the trade as soon as the SAR Oscillator bars become negative.
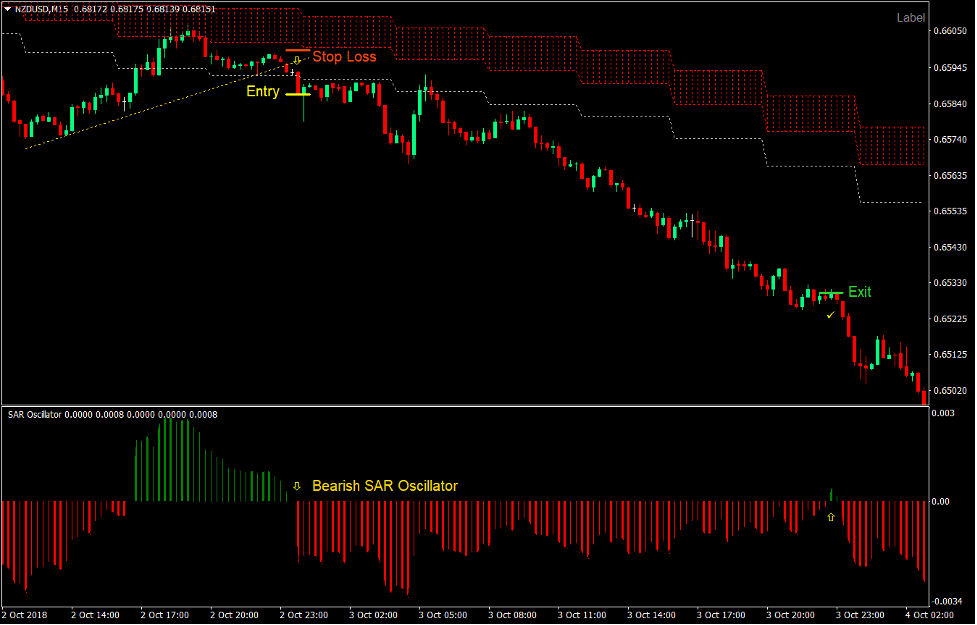
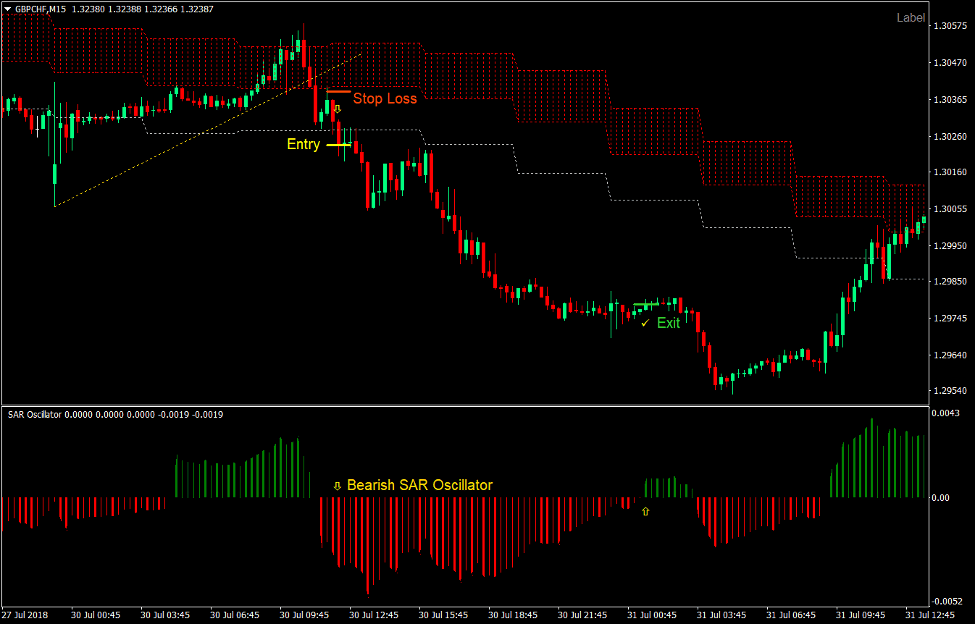
Sell Trade Setup
Entry
- The Forex Cloud indicator should display a red shaded area above price indicating a bearish long-term trend.
- Price should retrace towards the red shaded area.
- A diagonal or horizontal support line should be observable.
- Price should break below the support line.
- Price should break below the dotted silver line of the Forex Cloud indicator.
- The SAR Oscillator bars should become negative indicating a bearish trend reversal.
- These bearish signals should be closely aligned.
- Enter a sell order on the close of the candle breaking below the silver dotted line.
Stop Loss
- Set the stop loss on the bottom edge of the red shaded area of the Forex Cloud indicator.
Exit
- Close the trade as soon as the SAR Oscillator bars become positive.
Conclusion
The SAR Cloud Breakout Forex Trading Strategy is an excellent strategy to use in a long-term trending market condition.
It is even more effective when aligned with a price pattern trade setup on the higher time frame. As an example, the sell trade on the NZDUSD 15-minute chart above is a bearish flag pattern on the 4-hour chart.
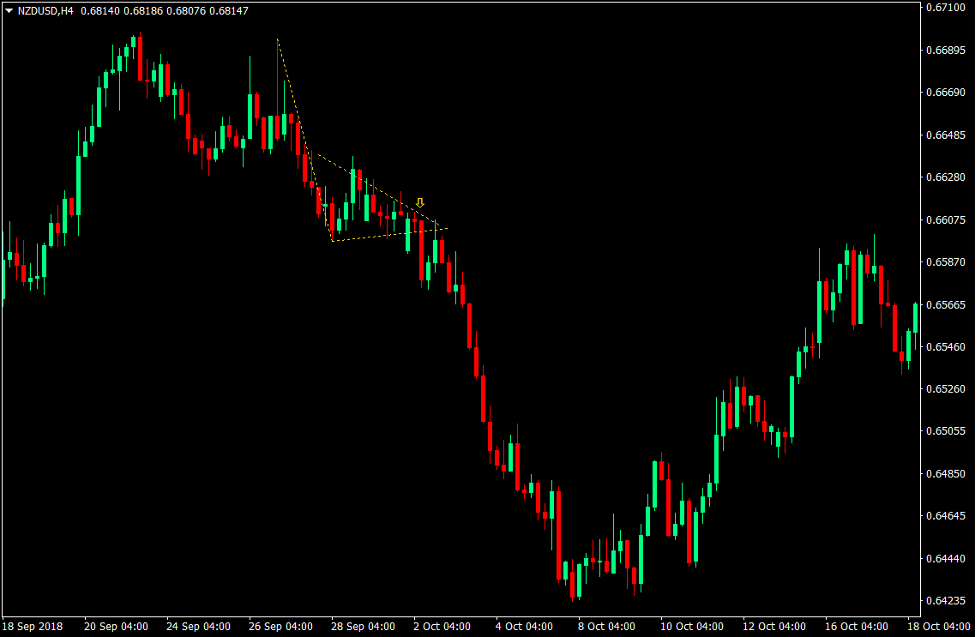
It takes a lot of patience to wait for price patterns to form on the higher timeframes. It also takes skill and a lot of practice to master pattern trading but once you learn it, it is a great tool to use as a confirmation to this strategy.
Trade wisely.
Recommended MT4 Brokers
XM Broker
- Free $50 To Start Trading Instantly! (Withdraw-able Profit)
- Deposit Bonus up to $5,000
- Unlimited Loyalty Program
- Award Winning Forex Broker
- Additional Exclusive Bonuses Throughout The Year

>> Sign Up for XM Broker Account here <<
FBS Broker
- Trade 100 Bonus: Free $100 to kickstart your trading journey!
- 100% Deposit Bonus: Double your deposit up to $10,000 and trade with enhanced capital.
- Leverage up to 1:3000: Maximizing potential profits with one of the highest leverage options available.
- ‘Best Customer Service Broker Asia’ Award: Recognized excellence in customer support and service.
- Seasonal Promotions: Enjoy a variety of exclusive bonuses and promotional offers all year round.

>> Sign Up for FBS Broker Account here <<
Click here below to download: