


The MACD Histogram Indicator is a technical analysis tool that is used to identify changes in the momentum, strength, and direction of a trend. It is a variation of the Moving Average Convergence Divergence (MACD) indicator, which is one of the most popular technical indicators used by forex traders.
Why Is It Important?
The MACD Histogram Indicator is important because it provides traders with a visual representation of the MACD histogram, which is a key component of the MACD indicator. By analyzing the MACD histogram, traders can identify changes in the momentum, strength, and direction of a trend, which can help them make more informed trading decisions.
How Does It Work?
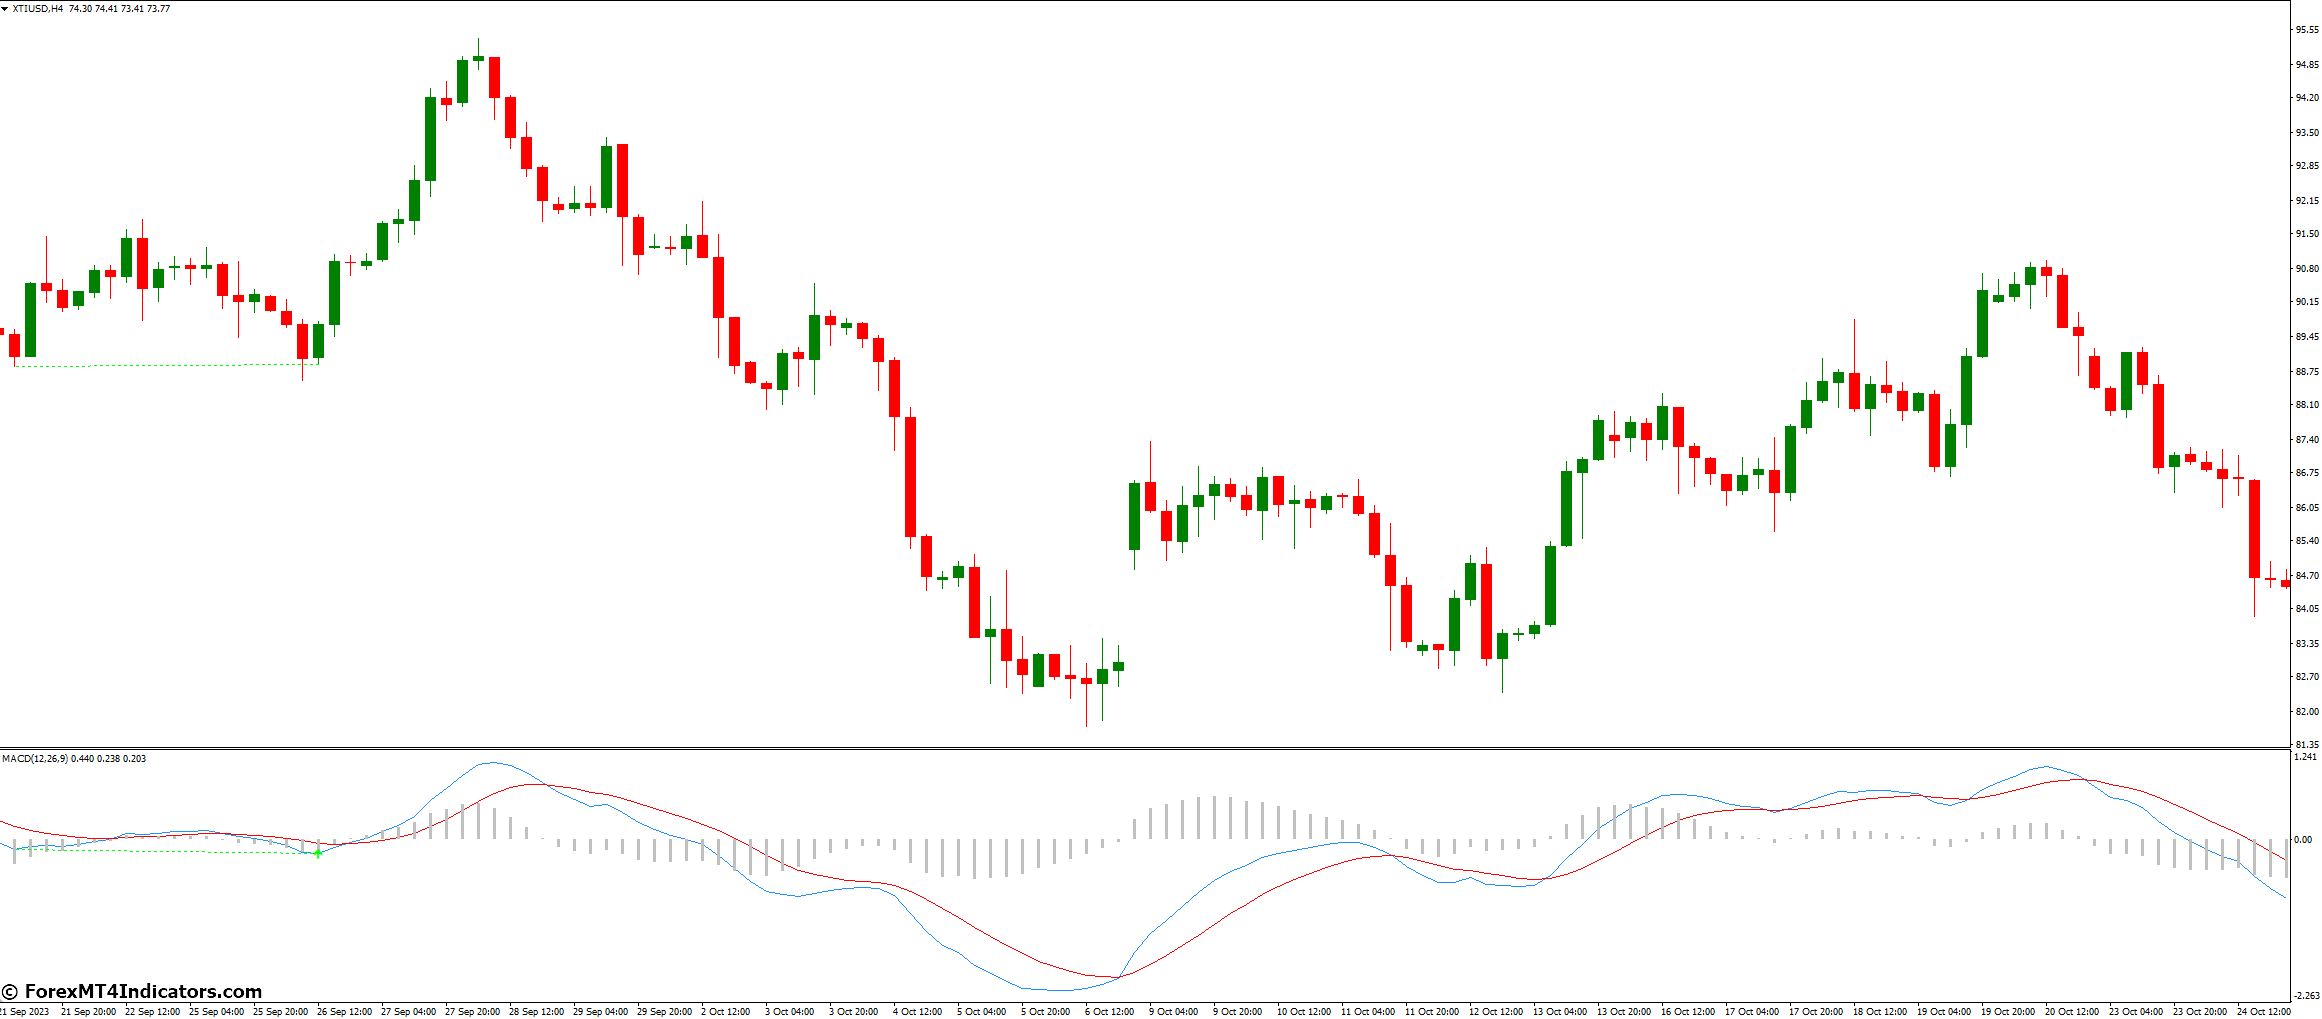
The MACD Histogram Indicator works by measuring the difference between two moving averages, which are typically the 12-period and 26-period exponential moving averages (EMAs). The difference between these two moving averages is then plotted as a histogram, which oscillates above and below a zero line.
When the MACD histogram is above the zero line, it indicates that the short-term moving average is above the long-term moving average, which is a bullish signal. Conversely, when the MACD histogram is below the zero line, it indicates that the short-term moving average is below the long-term moving average, which is a bearish signal.
What Are The Benefits of Using the MACD Histogram Indicator?
The MACD Histogram Indicator has several benefits, including:
- It is a versatile tool that can be used to identify changes in the momentum, strength, and direction of a trend.
- It is easy to use and interpret, making it a popular choice among traders.
- It can be used in conjunction with other technical indicators to confirm trading signals.
- It can be customized to suit the needs of individual traders.
What Are The Limitations of The MACD Histogram Indicator?
The MACD Histogram Indicator also has some limitations, including:
- It is a lagging indicator, which means that it may not provide timely signals in fast-moving markets.
- It can generate false signals in choppy or sideways markets.
- It may not be suitable for all trading styles or strategies.
What Are The Key Terms Associated with the MACD Histogram Indicator?
Some key terms associated with the MACD Histogram Indicator include:
- Moving Average Convergence Divergence (MACD): A technical analysis tool that measures the difference between two moving averages.
- Exponential Moving Average (EMA): A type of moving average that gives more weight to recent price data.
- Signal Line: A nine-period EMA of the MACD line.
- Zero Line: The line that separates positive and negative values on the MACD histogram.
What Are The Different Types of MACD Histogram Indicators?
There are several different types of MACD Histogram Indicators, including:
- Standard MACD Histogram Indicator: The most basic version of the MACD Histogram Indicator.
- MACD Colored Histogram Indicator: A variation of the MACD Histogram Indicator that uses different colors to indicate changes in momentum.
- MACD 4C Indicator: A more advanced version of the MACD Histogram Indicator that is designed for forex traders.
How to Trade with MACD Histogram Indicator
Buy Entry
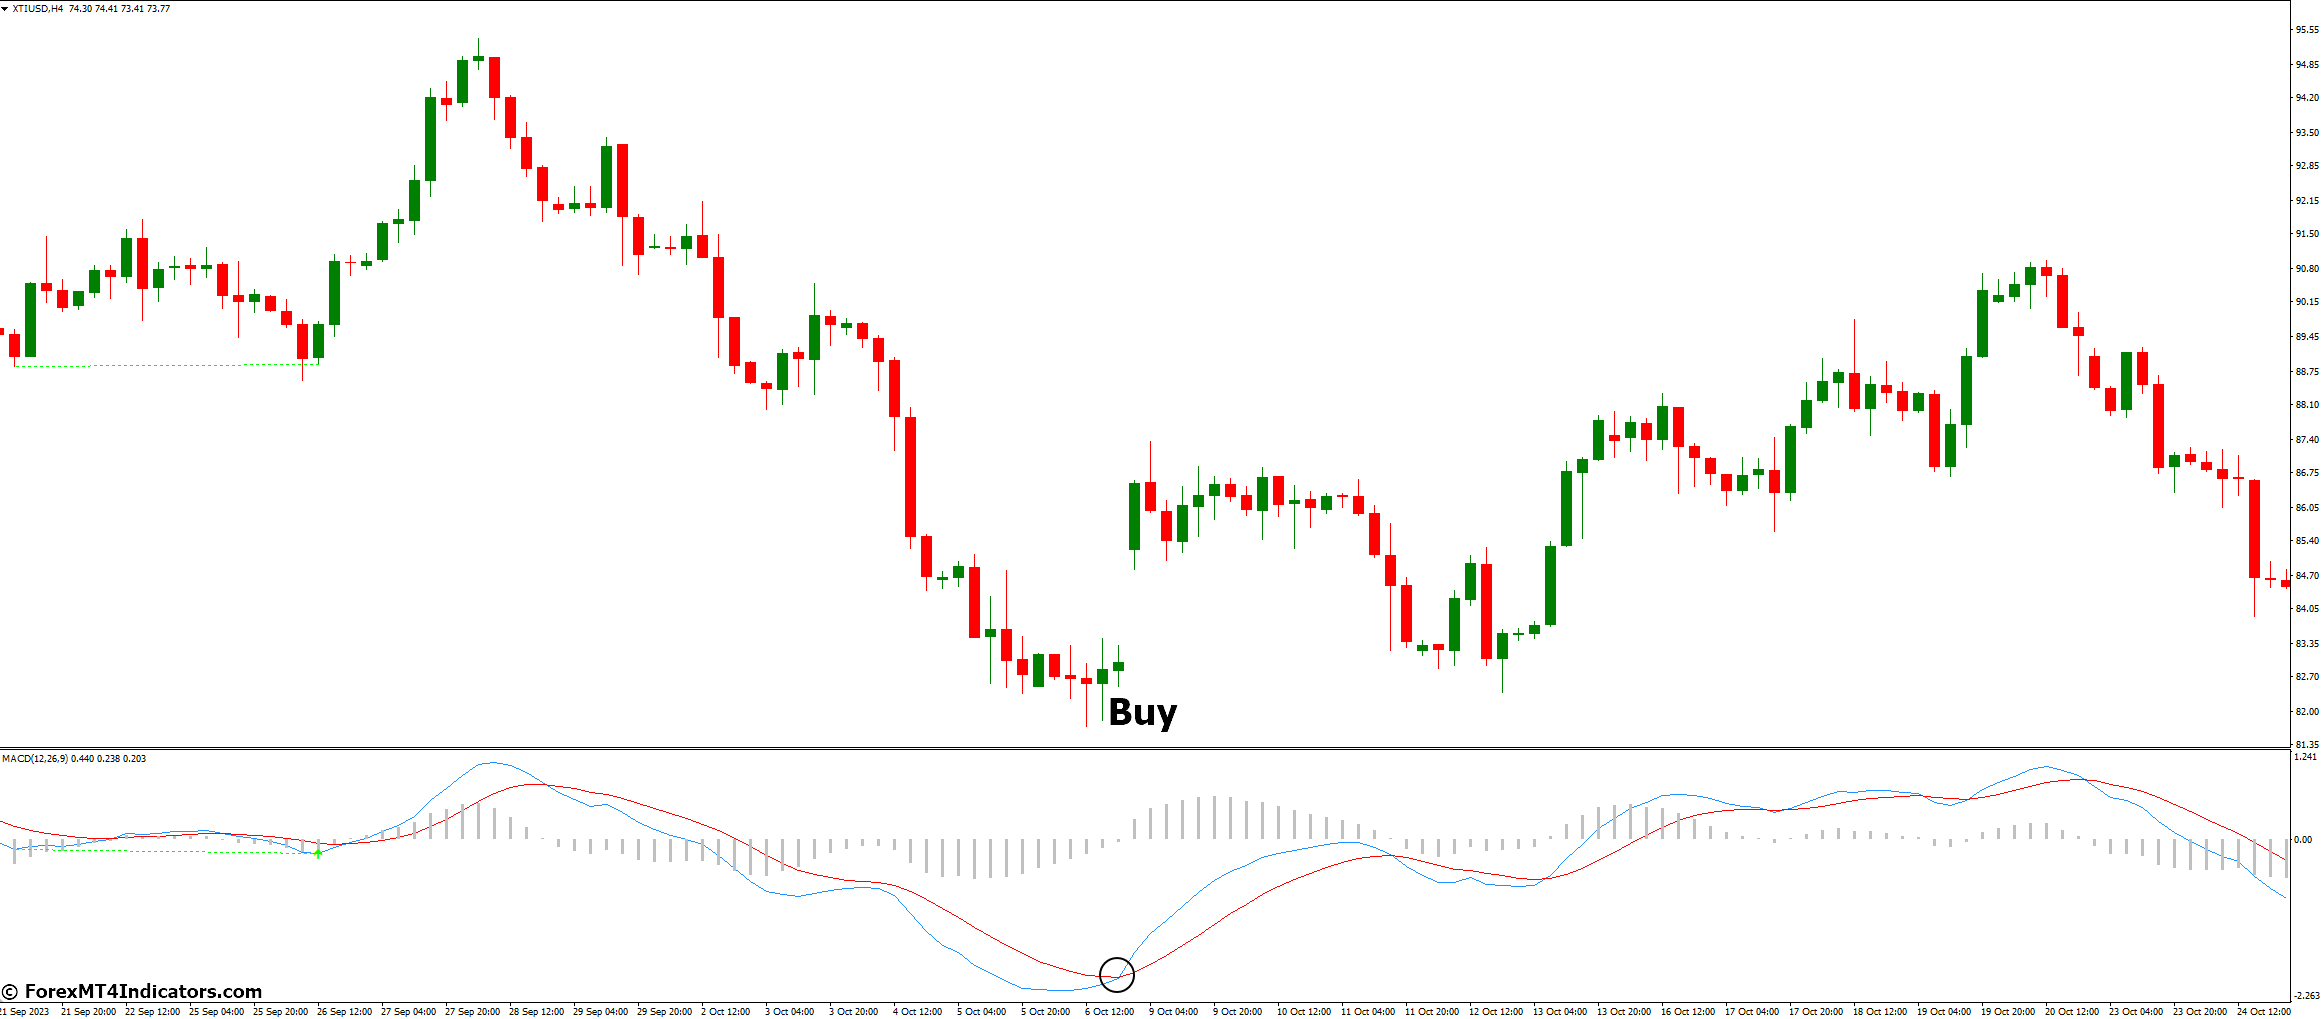
- Wait for the MACD histogram to cross above the signal line. This is a bullish signal.
- Enter the trade at the opening of the next candle.
- Place a stop-loss order below the recent swing low.
- Set a take-profit order at a level that is at least twice the size of the stop-loss order.
Sell Entry
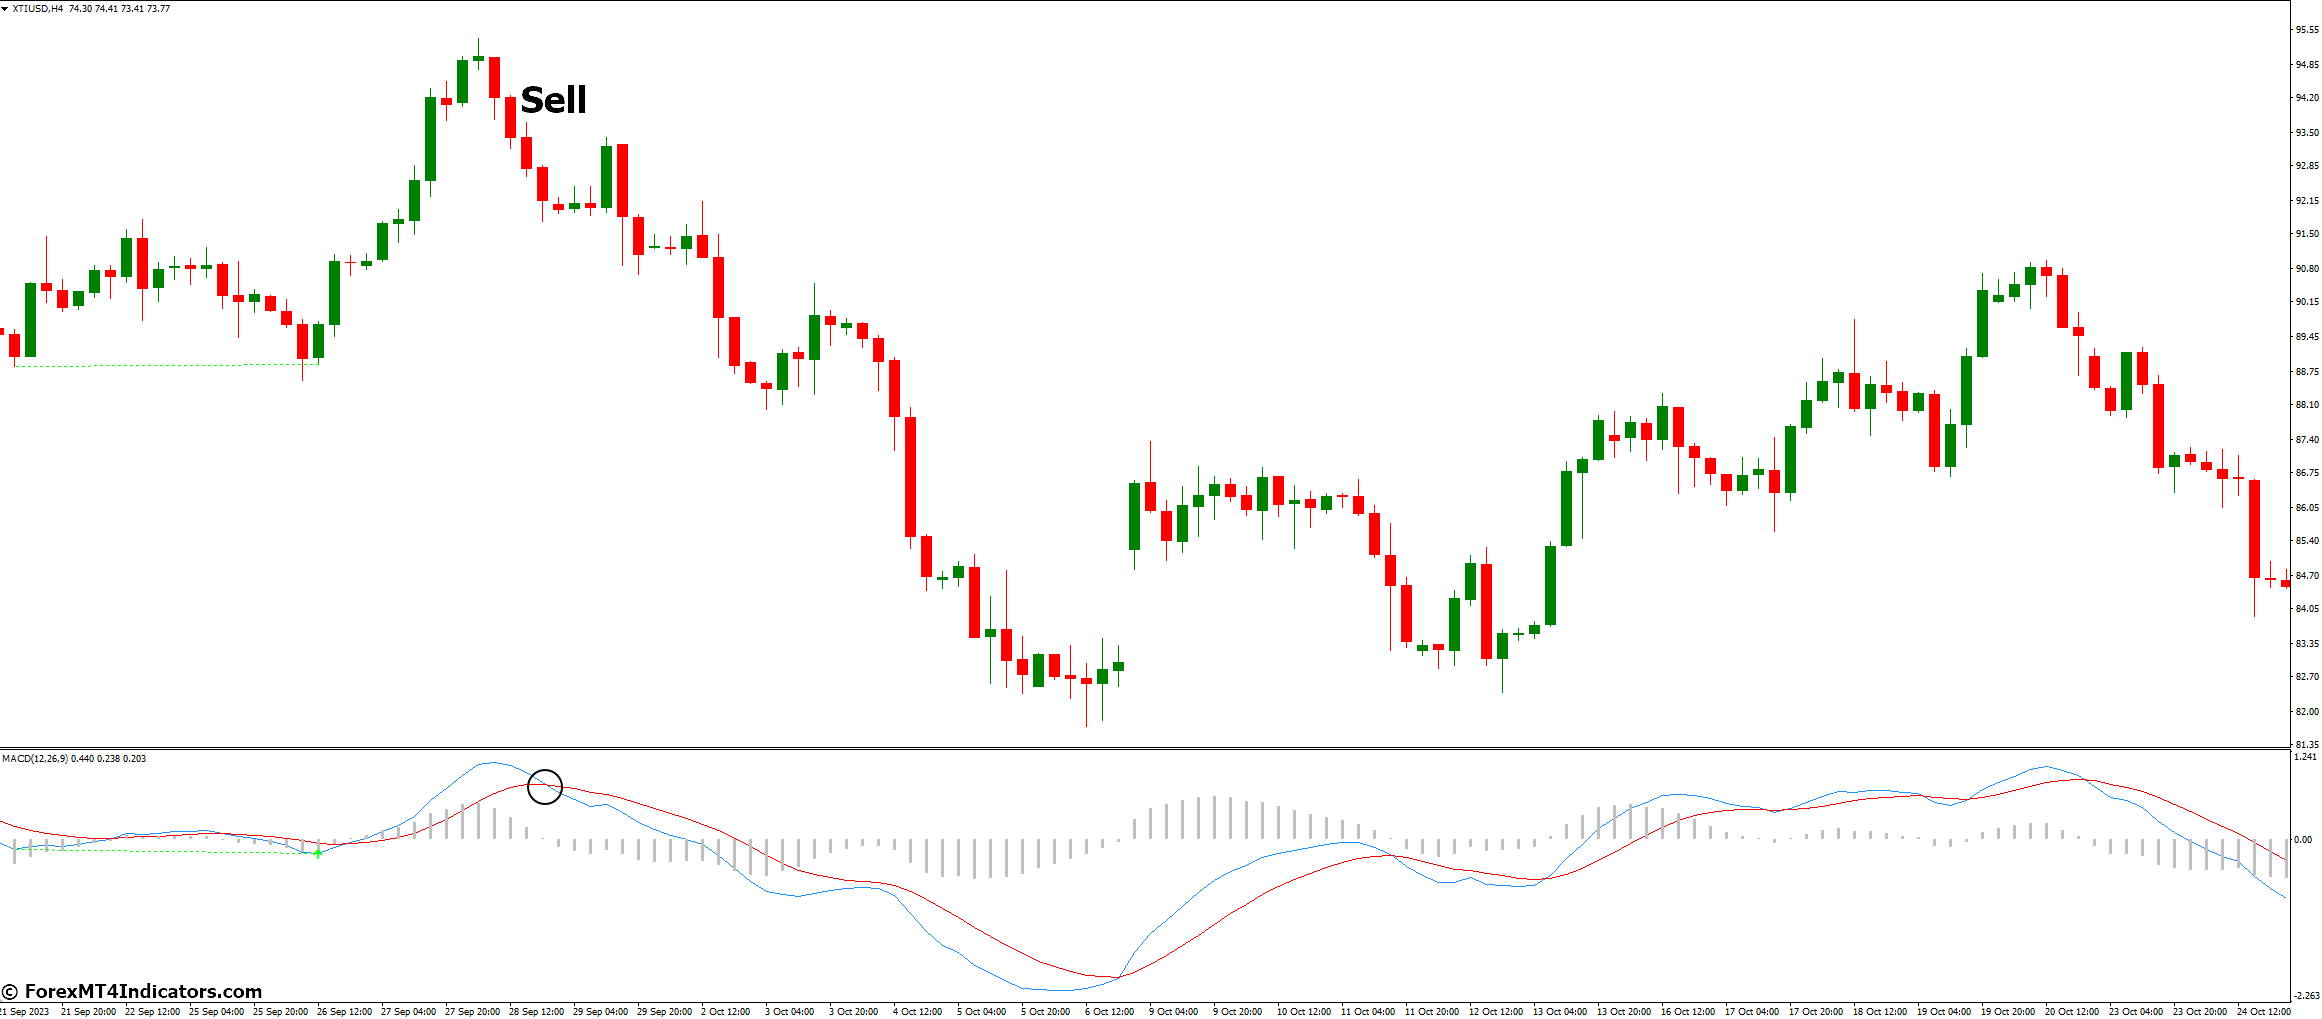
- Wait for the MACD histogram to cross below the signal line. This is a bearish signal.
- Enter the trade at the opening of the next candle.
- Place a stop-loss order above the recent swing high.
- Set a take-profit order at a level that is at least twice the size of the stop-loss order.
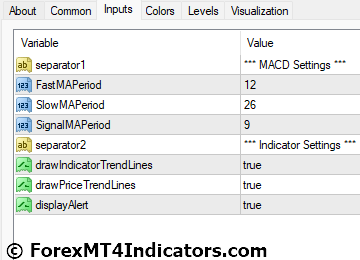
MACD Histogram Indicator Settings
Conclusion
The MACD Histogram Indicator for MetaTrader 4 is a popular technical analysis tool used by traders to analyze markets. It is a momentum oscillator that measures the features of a trend, such as the direction, amount, and speed at which it is occurring. The indicator is used to follow trends and review potential price reversals.
Recommended MT4/MT5 Brokers
XM Broker
- Free $50 To Start Trading Instantly! (Withdraw-able Profit)
- Deposit Bonus up to $5,000
- Unlimited Loyalty Program
- Award Winning Forex Broker
- Additional Exclusive Bonuses Throughout The Year

>> Sign Up for XM Broker Account here <<
FBS Broker
- Trade 100 Bonus: Free $100 to kickstart your trading journey!
- 100% Deposit Bonus: Double your deposit up to $10,000 and trade with enhanced capital.
- Leverage up to 1:3000: Maximizing potential profits with one of the highest leverage options available.
- ‘Best Customer Service Broker Asia’ Award: Recognized excellence in customer support and service.
- Seasonal Promotions: Enjoy a variety of exclusive bonuses and promotional offers all year round.

>> Sign Up for FBS Broker Account here <<

(Free MT4 Indicators Download)
Click here below to download: