


There are trading strategies that would cause you to hold a trade for so long and for so many candles at a time. These kinds of trade are great, they allow you to maximize profits on every trade. However, there are also strategies that allow you to get in and get out quick enough and make some money. These are the kinds of trades that are not as stressful because you don’t have to wait for so long and fidget while waiting for 10, 15, even 20 candles before closing the trade.
Keltner Reversal Forex Trading Strategy is one of those strategies that would allow you to get in and get out of the trade on an average of 5 candles, sometimes even less. This strategy allows for quick profitable trades on a short span of time relative to the timeframe used by trading short-term reversals on an overextended market condition.
The Keltner Channel
The Keltner Channel is a volatility-based indicator that marks overextensions on the chart itself based on a moving average. It somehow looks and works almost the same way as the widely known Bollinger Bands. It has a midline based on a moving average and a couple of lines enveloping the midline, one above and one below it.
The difference however lies in a couple of features. First, the Keltner Channel is based off the Exponential Moving Average. This allows for a somewhat smoother average as compared to the Bollinger Bands. Then, the outer bands. While the Bollinger Bands are based off a computation of the standard deviation, the Keltner Channel’s outer bands are based off the Average True Range (ATR). This feature seems very logical. Average True Range is derived from the average range of a period or the average size of a candle. If price deviates far enough from the mean, which in this case is the exponential moving average, causing it to be more than 1x the ATR or more away from the mean, that could be a potential reversal. Imagine the outer bands as a rubber band. As price pushes out towards the outer bands, these bands tend to push price back towards the mean. The stronger price pushes towards the outer bands, the stronger the reaction would be and would often cause price to push to the other side of the band.
Stochastic Oscillators
The Stochastic Oscillator is a popular oscillating indicator based on momentum. It is a bounded oscillator, which means that it moves within a fixed range. In this case, stochastic oscillators move from zero to 100 with 50 as its midline. It draws to lines that weave and cross each other. If the faster line crosses the slower line to the upside, then it is a buy signal. If the faster line crosses the slower line to the downside, then it is a sell signal. Since the stochastic oscillator is a bounded oscillator, it allows traders to mark an area which we could consider as oversold or overbought, which is usually at 20 and 80. Signals occurring beyond these lines are considered as high probability due to the tendency of price to revert back to the mean whenever price is oversold or overbought.
Trading Strategy Concept
Because of the nature of the two indicators, having indications of when the market is oversold or overbought, these two indicators could be considered as complimentary. This strategy is based on the concept of taking trades whenever signals are generated by the two indicators when the market is oversold or overbought.
This strategy first filters out trades based on the general trend direction. This strategy makes use of the 50-period Exponential Moving Average (EMA) as the basis for the trend. Trend is judged based on the location of price in relation to the 50 EMA. The market is considered bullish if price is above the 50 EMA, and bearish if price is below it.
Then, we wait for a confluence of oversold or overbought conditions on the two indicators. If the trend is bullish, we would wait for price to make a short-term reversal that would cause price to be oversold based on the Keltner Channel. This would be when price closes below the lower outer band. Then, we wait for price to close back inside the Keltner Channel, indicating that price might be reacting to the oversold condition causing a possible reversal.
As the above situation happens on the Keltner Channel, the Stochastic Oscillator should also be showing an oversold market condition by having both lines below 20. Then, we wait for the faster line to cross above the slower line signaling a buy trade setup. We then take the trade on the confluence of these conditions.
As for a sell setup on a bearish trending market, flip the conditions over for the confluence of an overbought condition on a bearish trend.
Indicators:
- 50 EMA (gold)
- Keltner_Chanel
- MA Period: 10
- ATR Period: 10
- Kshift: 1
- Stochastic Oscillator
- %K period: 15
- %D period: 3
- Slowing: 2
Timeframe: any
Currency Pair: any
Trading Session: London and New York Session on 30-min timeframes and below; any trading session on timeframes above 1-hour
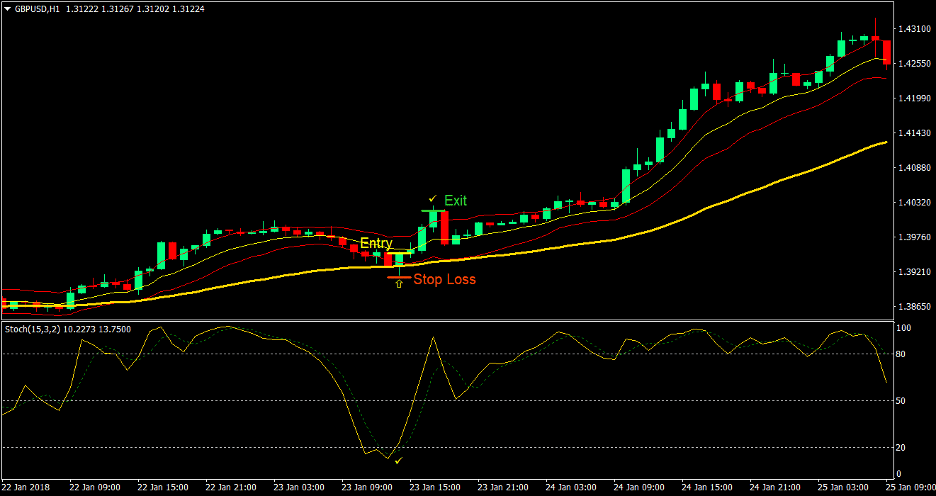
Buy (Long) Trade Setup
Entry
- Price should be above the 50 EMA
- Price should close below the lower outer band of the Keltner Channel
- The two lines of the Stochastic Oscillator should go below 20
- Enter a buy order as soon as price closes back inside the Keltner Channel and the faster line of the stochastic oscillator crosses above the slower line
Stop Loss
- Set the stop loss a few pips below the low of the candle
Exit
- Close the trade as soon as price closes above the upper outer band
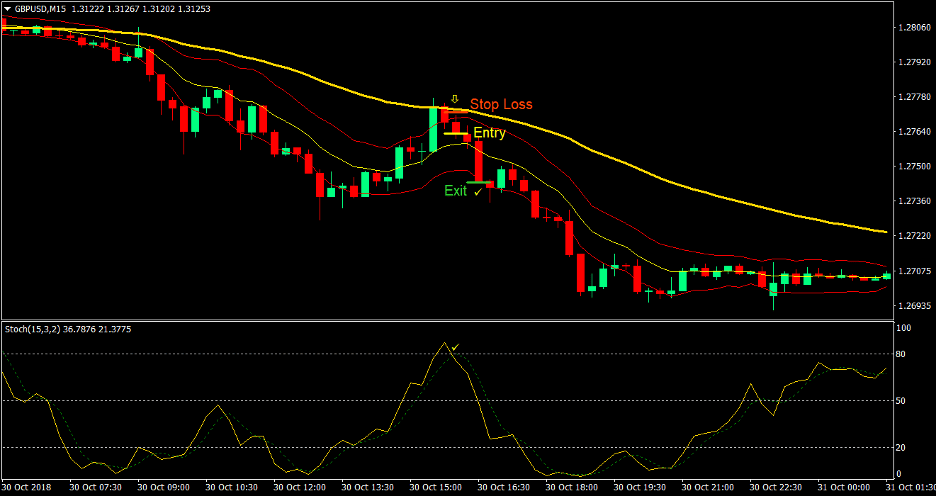
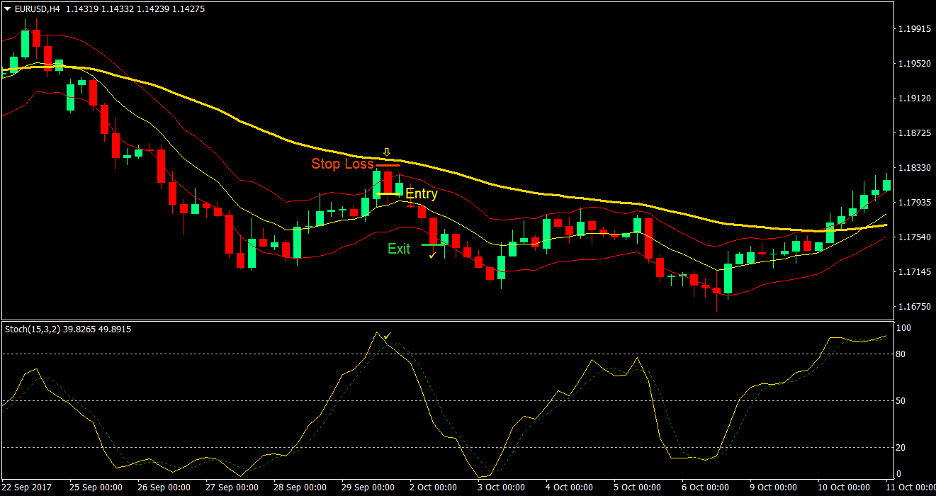
Sell (Short) Trade Setup
Entry
- Price should be below the 50 EMA
- Price should close above the upper outer band of the Keltner Channel
- The two lines of the Stochastic Oscillator should go above 80
- Enter a sell order as soon as price closes back inside the Keltner Channel and the faster line of the stochastic oscillator crosses below the slower line
Stop Loss
- Set the stop loss a few pips above the high of the candle
Exit
- Close the trade as soon as price closes below the lower outer band
Conclusion
This strategy is where taking trades in agreement with the trend and taking mean reversal trades meet. Purely mean reversal entries based on the Keltner Channel or the Stochastic Oscillator, without regard for the trend could work, but it would not have as high a probability as when these indicators are trading in the direction of the trend. This is because on a trending environment, price tends to resume its prior trend once it gets close enough to the mean.
Having the Keltner Channel and Stochastic Oscillator in confluence, while taking trades that agree with the direction of the 50 EMA, would often result to a high probability trade.
Recommended MT4 Brokers
XM Broker
- Free $50 To Start Trading Instantly! (Withdraw-able Profit)
- Deposit Bonus up to $5,000
- Unlimited Loyalty Program
- Award Winning Forex Broker
- Additional Exclusive Bonuses Throughout The Year

>> Sign Up for XM Broker Account here <<
FBS Broker
- Trade 100 Bonus: Free $100 to kickstart your trading journey!
- 100% Deposit Bonus: Double your deposit up to $10,000 and trade with enhanced capital.
- Leverage up to 1:3000: Maximizing potential profits with one of the highest leverage options available.
- ‘Best Customer Service Broker Asia’ Award: Recognized excellence in customer support and service.
- Seasonal Promotions: Enjoy a variety of exclusive bonuses and promotional offers all year round.

>> Sign Up for FBS Broker Account here <<
Click here below to download: