


Diagonal Breakout Bounce Forex Trading Strategy
As traders we often find ourselves wishing to catch one of those big moves. Those types of trades where we catch a reversal as it reverses. Well, those types of trades are very hard to catch and are few and are far between. But yes, it is possible catch it.
One of the most common types of strategy that traders like to employ are breakout types of strategies. Might be because of the rapid expansion of volatility and price movements going in one direction as price breaks out of a trendline.
Probably the most common type of breakout that traders look at are breakouts from horizontal supports and resistances. But breakouts from diagonal supports and resistances are also very profitable. This is because these types of breakouts are often reversal breakouts, which allows you to catch a move close to where it started.
One thing about breakouts from diagonal supports and resistances, these supports and resistances are often part of a structure. These could vary from channels, to price patterns like the wedges or triangles. And as part of structures, we often know that sooner or later, these structures will end and breakout. Sometimes, even as beginner traders, we could even guess rightly what the structure is and even the direction where it would breakout depending on the pattern. However, even though we could identify the structure, and the direction, we often do not know the timing of when it would breakout.
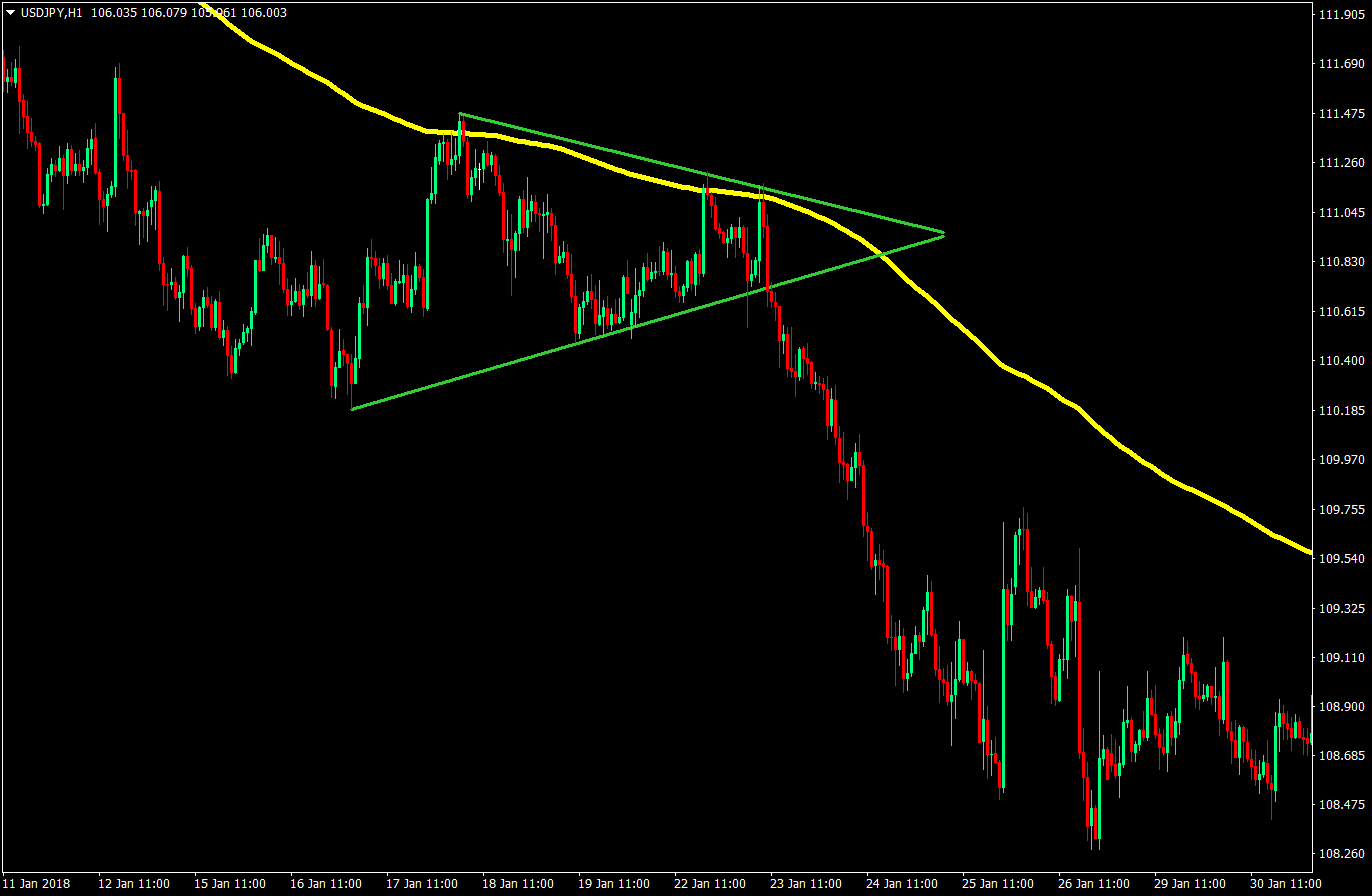
There also times when the structure that price has formed doesn’t indicate where which direction price would more likely breakout to. A triangle pattern for example would tell us that price is contracting and would soon breakout, but we couldn’t intelligently guess which direction it is more likely to breakout to.
What if we have a way to gauge if a structure like a channel is ready to reverse? What if we have a way to increase the probability of guessing rightly which way a triangle pattern would breakout? Well, we have a way. It is not perfect, but it helps. And it is a very simple addition to our chart, we often overlook it. It is so common many traders look to it for guidance regarding the long-term trend. It is our good old friend the 200 Exponential Moving Average (EMA).
One characteristic of moving averages is that it often acts as a dynamic support. And like all the other moving averages, the 200-EMA is no different in this regard. However, the shorter period EMAs like the 20-EMAs or even the 50-EMAs often hug price too close, it sometimes doesn’t allow for major price structures to form. For example, what we would see if a triangle pattern is forming around a 20-EMA is price whipsawing our moving average. This is where the 200-EMA stands out. The 200-EMA moves fairly slow and doesn’t hug price too much, allowing price structures to form near it, without letting price whipsaw it. This allows us as traders to make more sense of what price wants to do.
We might see a channel that is forming, but it might actually be reverting to its mean, which is the 200-EMA. As price gets near or touches the 200-EMA, we would already have an idea that price might bounce off the 200-EMA and start to breakout of the channel.
We might see a triangle pattern forming near the 200-EMA, but it doesn’t whipsaw our moving average. Then we have an idea which way the triangle pattern is more likely to breakout to.
To give more light to what we are trying to accomplish, let’s jump straight to our sample setups.
The Setup: Channel Breakout from a 200-EMA Bounce
This is an example of our channel that has broken out on the top side bouncing off of the 200-EMA.
So, how do we trade this.
Buy Setup:
- Plot the trendlines forming the price structure – Channel
- Identify the location of price in relation to the 200-EMA
- If price is above the 200-EMA, anticipate a breakout from resistance as soon as price starts touching the 200-EMA
- As soon as price breaks out and closes above the resistance, enter the trade with a market order
Stop Loss: Stop loss should be a few pips below the entry candle.
Exit: Trail the stop loss on fractals until stopped out on profit.
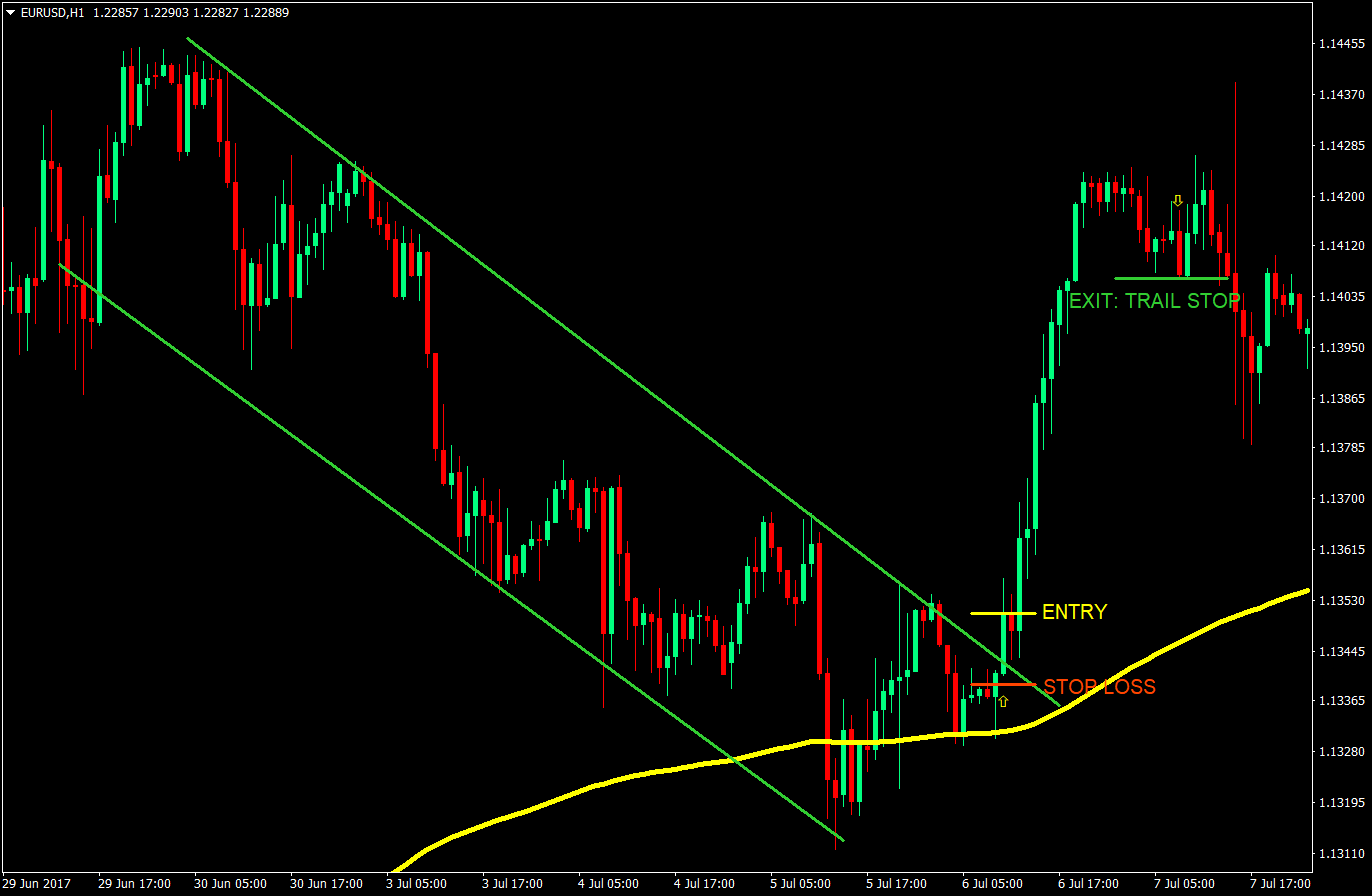
Notice how price stops dead in its tracks at the area near the 200-EMA. It then started to contract as it gets squeezed in between the 200-EMA and the resistance. Then, right after the contraction was the violent expansion to the upside. Another thing to take note of also, if you are a price action trader. Price also did retest the broken resistance after the breakout, although retests don’t always happen.
Also, if you would notice, there were no fractals formed due to the rapid expansion of price going to the upside. What we could do however, is trail the stop loss a few pips below a couple of candles prior to our current candle, until we find a fractal.
Now let’s go to our triangle setup and see how we could have a higher probability in guessing the direction of the breakout.
Sell Setup:
- Plot the trendlines forming the price structure – Triangle
- Identify the location of price in relation to the 200-EMA
- If price is below the 200-EMA, anticipate a breakout from support as soon as price starts touching the 200-EMA
- As soon as price breaks out and closes below the support, enter the trade with a market order
Stop Loss: Stop loss should be a few pips above the entry candle.
Exit: Trail the stop loss on fractals until stopped out on profit.
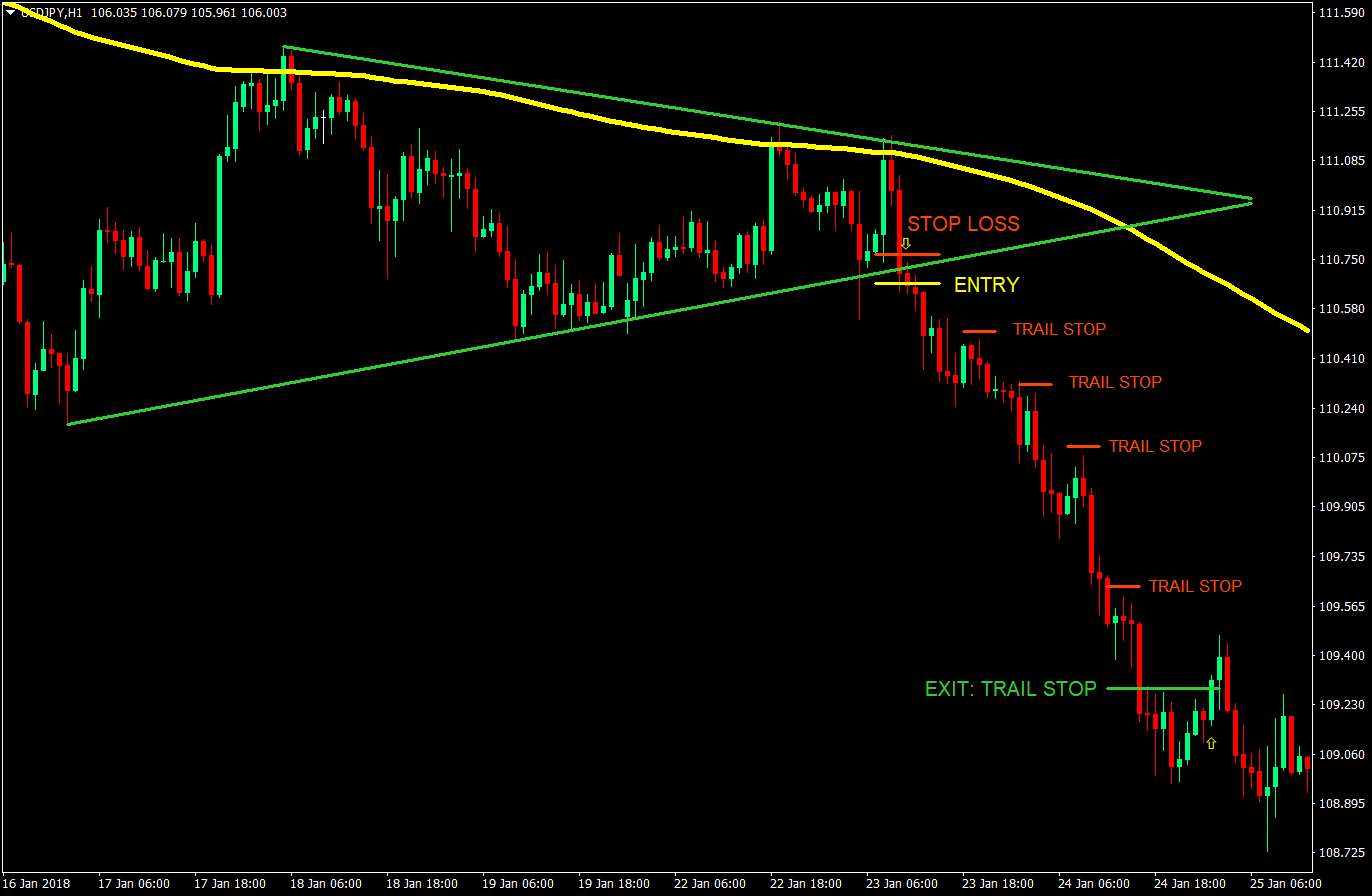
Notice how the highs within the triangle are actually just peeks above the 200-EMA and couldn’t even strongly close above it. This is already an indication that price is respecting the 200-EMA, and that chances are the triangle is going to breakout on the downside. Having an idea of where a triangle pattern will breakout is already a massive edge. Now, all we have to do is wait for a strong bounce off the 200-EMA that would break the support line. And it did. Although, the close wasn’t too far below from the support line. In this case, it might be better to set a pending Sell Stop Entry Order below the long breakout candle. But for the sake of this setup, we entered the market on the close of the next candle. Also, if you’d continue the chart further right, it would have gained a few more pips, however, if we would trail our stop loss aggressively, we would have been stopped out at the level indicated as our exit above.
Conclusion
The 200-EMA is a great tool even for price action and breakout traders. It not only gives us an idea with regards to the direction of price, but it also helps traders make sense of the chart. By putting in the 200-EMA, a channel or a triangle or any other pattern for that matter wouldn’t be just a random price structure on a chart, but a part of the story of a big picture trend.
This strategy does work. However, looking for trades using this strategy alone might bore some traders, since trades using this strategy don’t come too often. This is because some smaller structures breakout to the direction indicated by the 200-EMA even without touching it. This is because other shorter EMAs such as the 50 and 100 EMA also act as a dynamic support. Think of the 200-EMA as the last line of defense. As the last line of defense, price often don’t get to come near it. Also, in some cases, the trend has already weakened too much that when it crosses the 200-EMA, it actually is a long-term reversal of a trend.
Study the 200-EMA as a big picture trend indicator. This will be helpful whether you’re a price action trader, or even an indicator based algorithmic trader. As always, happy trading.
Recommended MT4 Broker
- Free $50 To Start Trading Instantly! (Withdrawable Profit)
- Deposit Bonus up to $5,000
- Unlimited Loyalty Program
- Award Winning Forex Broker
- Additional Exclusive Bonuses Throughout The Year

>> Claim Your $50 Bonus Here <<
Click here below to download: