


Awesome Ozzy Forex Trading Strategy
I don’t know about you but having your name on the MT4 platform is a great feat. Only a few traders could claim that – Bollinger, Keltner, etc. But having a whole section of indicators under your name, that is whole different ball game. A claim to fame that only one trader could brag about – the great Bill Williams.
The Awesome Oscillator Indicator
Although Bill has a lot of indicators under his name, I find the Awesome Oscillator to be very interesting. I’m not sure why he named it that way, but though he uses a pretty simple equation for the Awesome Oscillator, its simplicity doesn’t take away anything from its awesomeness.
The Awesome Oscillator plots histogram bars using the equation below.
The histogram bars are then plotted based on the difference of the two equations. If the fast period is higher than the slow period, the histogram bar plotted would be positive. If on the other hand, the fast period is lower than the slow period, the histogram bar would be negative.
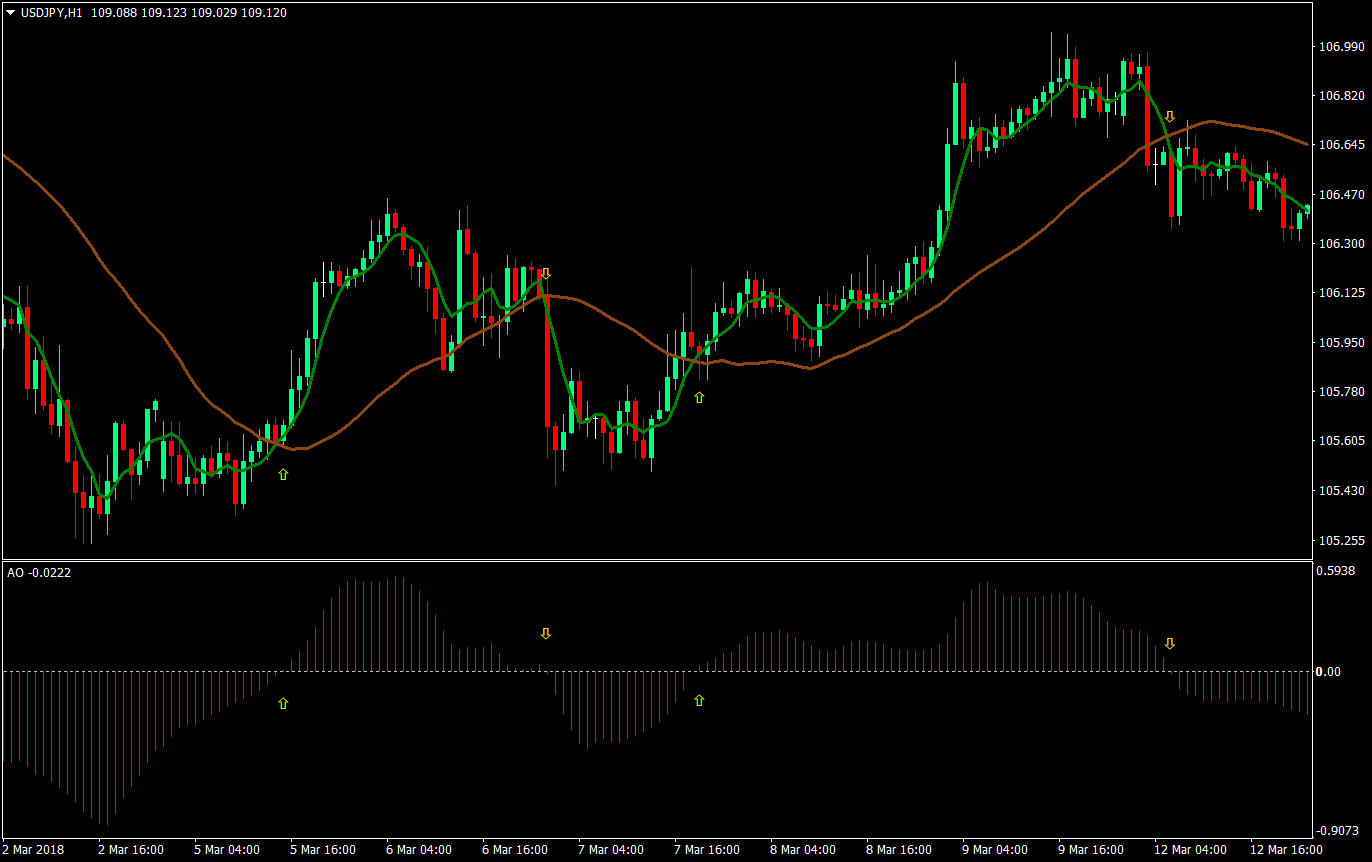
If you’d come to think of it, based on the formula, the Awesome Oscillator is basically a crossover of the 5 and 34 Simple Moving Averages (SMA). To prove the point, you could look at the chart below with the 5 SMA (green), 34 SMA (brown), and the Awesome Oscillator on the indicator window. Notice how the crossovers of the SMAs coincide with the change from positive to negative and back on the Awesome Oscillator.
Pros and Cons of the Awesome Oscillator
One of the main disadvantages of the Awesome Oscillator is that on the MT4 platform, the parameters couldn’t be tweaked. You could not change the periods used, and you could not change the type of moving average the Awesome Oscillator would use. However, there might be other custom indicators out there that could allow you to do that.
Another disadvantage is the fact that unlike other oscillators, the Awesome Oscillator plots figures based on the absolute difference of the two periods and not as a percentage of a range. This means that the Awesome Oscillator could bob up and down the zero line with an infinite range, instead of being bound by a fixed range from zero to 100, like the Stochastics or RSI. Because of this, the Awesome Oscillator might not be the right tool to identify overbought and oversold market conditions, because it would be extremely difficult to compare overbought and oversold market conditions in an infinite range.
However, because the Awesome Oscillator plots the absolute difference of two moving averages as a histogram, it allows us to identify if the figure plotted is higher or lower than the previous figure. It is further visually aided by the changing of colors. If the number plotted is higher than the previous plot, the histogram bar would be green. If the number plotted is lower, then the histogram bar would be red.
Strategy Concept
Because the Awesome Oscillator is based on a moving average crossover, we could use that crossover as our basis for trend bias, much like the usual crossover strategies. If the 5 SMA is above the 34 SMA, then our bias would be bullish. If it is the reverse, then our bias would be bearish. However, because the Awesome Oscillator plots histogram bars based on the zero line, we will have no need to plot the 5 and 34 SMA on our chart. Instead, we could base our trend bias on whether the Awesome Oscillator is positive or negative. If the Awesome Oscillator is positive, then our bias would be bullish. If it is negative, then our bias would be bearish.
Now, that we have identified our trade direction based on the trend bias, what we have to deal with next is the entry.
Because the Awesome Oscillator changes color from red to green or green to red to identify if the current bar is higher or lower than the previous bar, we could easily identify minor retracements based on it. These retracements and resumption of trends would be our entries. What we would be looking for is for price to retrace based on the color of the histogram bar, then resume the trend again based on the color change of the histogram bar, while being in agreement with our main trend bias based on whether the Awesome Oscillator is above or below zero.
Buy Trade Setup
Entry
- Awesome Oscillator should be positive
- Histogram changed color from red to green
Stop Loss
- Set the stop loss at the fractal below the entry
Exit
- Close the trade as the histogram changes color from green to red
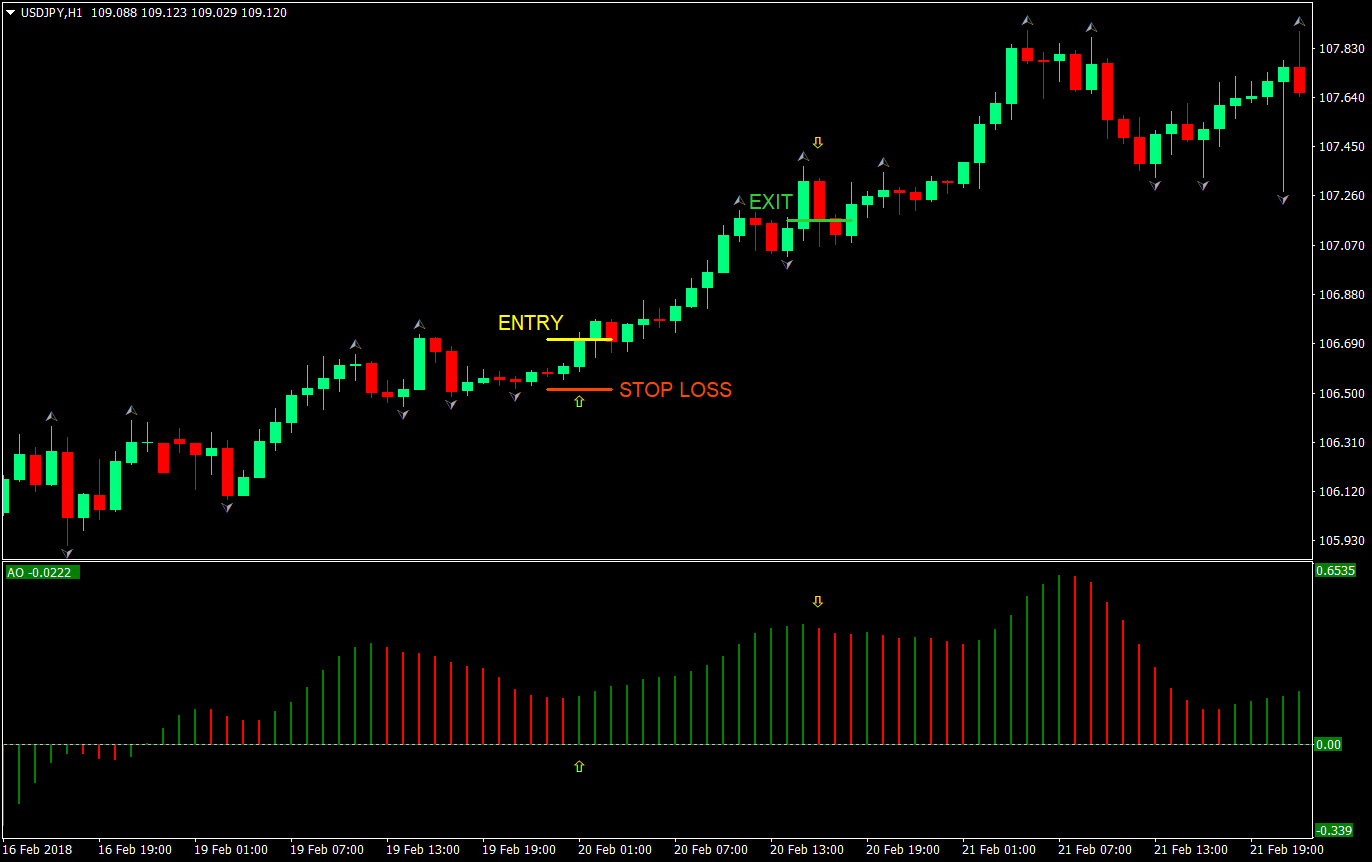
On this sample trade, the Awesome Oscillator based strategy gave us a profitable trade with a reward-risk ratio of 2:1.
However, there are several trades on this trend, based on the Awesome Oscillator, all of which yielded a profit, though a couple yielded a small profit compared to the risk.
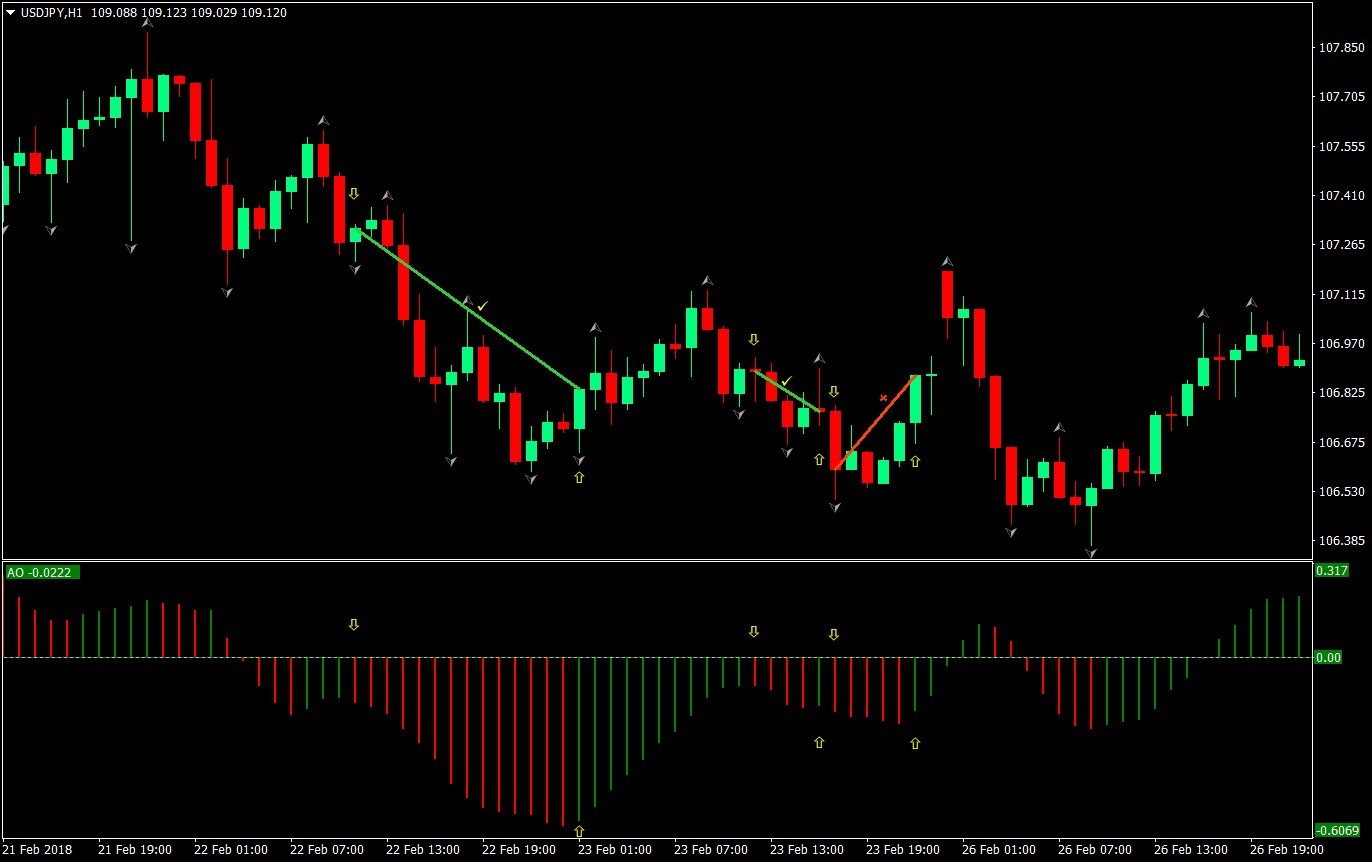
Sell Trade Setup
Entry
- Awesome Oscillator should be negative
- Histogram changed color from green to red
Stop Loss
- Set the stop loss at the fractal above the entry
Exit
- Close the trade as the histogram changes color from red to green

This trade sample yielded a profit with a reward-risk ratio of 1.5:1. However, there are a couple more of trades that fit our rules on this trend. Two of the three trades were profitable, while one resulted to a loss due to a sharp reversal leading to a gapping candle during the weekend.
Conclusion
This strategy is an excellent strategy based on one indicator, while using it mainly based on how the inventor of the indicator intended it to be used. At the same time, the strategy is built around the strength of the indicator, which is in identifying minor retracements and trend resumptions.
Its weakness however is when the trend loses steam. At this point, the trend may reverse causing a loss, just like one of the possible trades on the sell samples. To avoid this, some traders opt to skip trading the third retracement, while others only trade the first retracement.
On the other hand, some trends do last long, just as the buy sample chart, which yielded five profitable trades in one trend.
It is up to you as a trader to decide whether to take every trade that comes your way or to be a little conservative and limit your trades to the first few trades on a trend.
All in all, this is an excellent strategy with a purely indicator-based entry and exit. It has the potential to yield high win rates on some strongly trending market conditions, although the reward-risk ratio seems to be a bit of a variable.
Recommended MT4 Broker
- Free $50 To Start Trading Instantly! (Withdrawable Profit)
- Deposit Bonus up to $5,000
- Unlimited Loyalty Program
- Award Winning Forex Broker
- Additional Exclusive Bonuses Throughout The Year

>> Claim Your $50 Bonus Here <<
Click here below to download: