


The Renko Charts is a type of price charting which was also developed in Japan. It was first introduced to the traders in the United States by Steven Nison in his book, Beyod Candlesticks.
It is said that the Renko Charts derived its name from the Japanese word “renga”, which means “brick”. This is because Renko Charts present price movements using boxes which closely resembles stacked bricks.
What is the Renko Charts Indicator?
To efficiently plot a Renko Chart, traders would need a Renko Charts indicator which automatically plots price movements using the Renko Chart method.
Traditional price charts present price movements in a chronological manner wherein price movements are presented in relation to time periods. The y-axis of the chart represents price levels, while the x-axis of a chart indicates time periods, which could be based on minutes, hours, days or more.
The Renko Charts significantly diverges from this type of price presentation because it totally disregards time and focuses solely on price movements. This creates a chart which effectively indicates trends and momentum based on price movements using “bricks” or blocks to represent each unit of price movement.
How the Renko Charts Indicator Works?
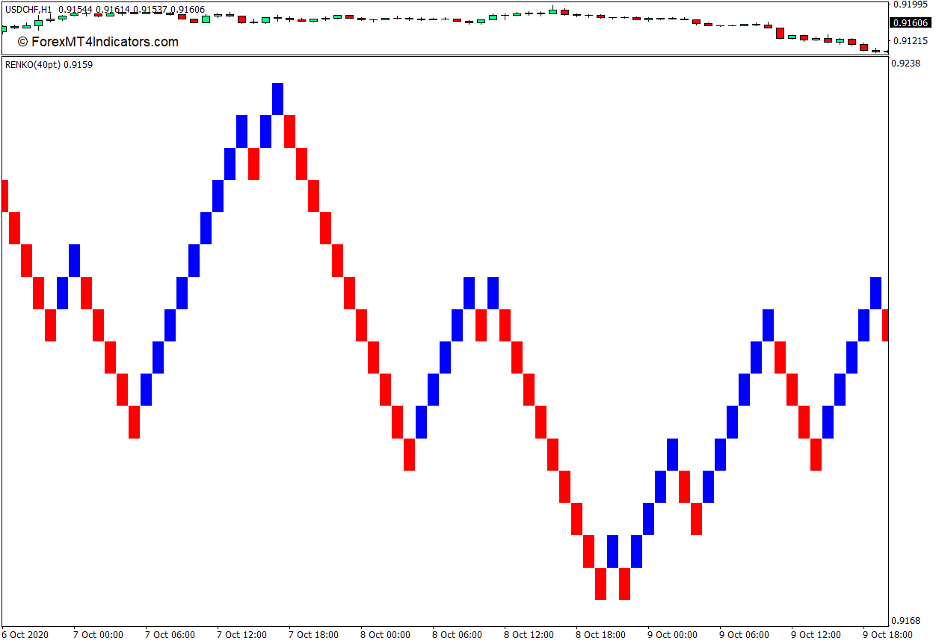
Renko Charts use “bricks” or blocks to represent each unit of price movement. This Renko Charts preset uses blue bricks
In the example above, each brick represents 40 points worth of price movement on the GBPUSD pair. If price moves up by 40 points or 4 pips, the Renko Charts indicator would plot one blue brick. If price moves by 80 points or more, it will plot two blue bricks. Inversely, if price moves down by 80 points or more, it will also plot two red bricks down.
Traders can modify the threshold number of points or pips each brick represents in order to fit the currency pair and time horizon it is used on.
How to Use Renko Charts for MT4?
As mentioned above, the Renko Charts plots price movements regardless of the period covered. As such, the bricks on the Renko Charts would not correlate with the Japanese candlesticks on the main price chart. Some traders who use Renko Charts would totally disregard the Japanese candlesticks and make their decisions solely on the Renko Charts. They would even minimize the actual price chart and view only the Renko Charts.
Color changes and direction shifts on the Renko Chart bricks would indicate a momentum or trend reversal. As such, traders can decide to buy whenever the Renko Chart starts to plot blue bars and sell on red bars. Traders can also opt to enter a trade based on a predetermined number of bricks moving in the same direction.
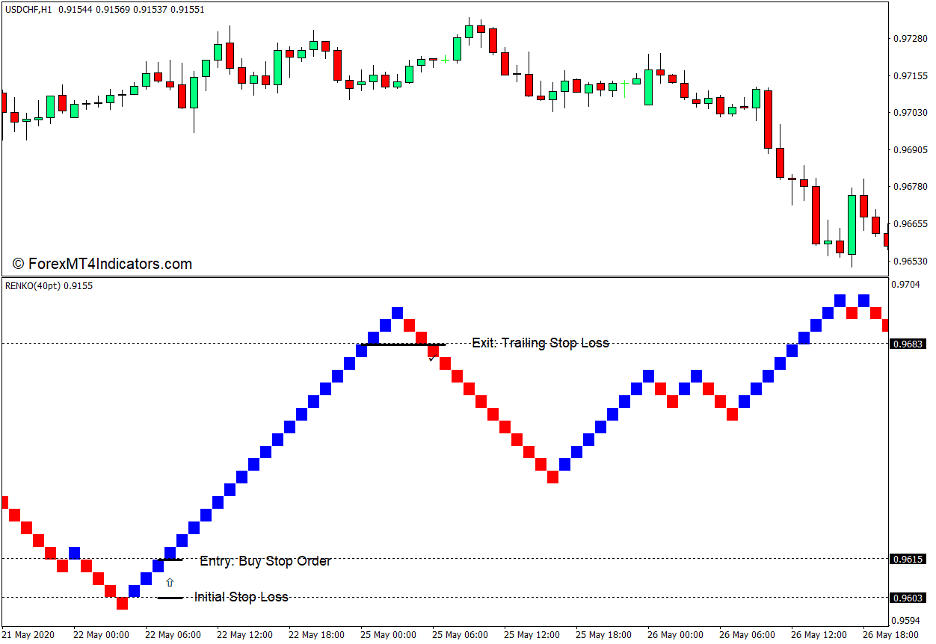
Buy Trade Setup
When to Enter?
Wait for price to reverse up and the Renko Charts to form three blue bricks. Determine the price corresponding to the high of the third blue brick and set a buy stop order at that price level. Set the stop loss at the price corresponding to the low of the brick three bricks behind the probable entry point.
When to Exit?
Trail the stop loss at the price corresponding to the third brick behind the current Renko Charts brick. Allow price to hit the trailing stop loss while in profit.
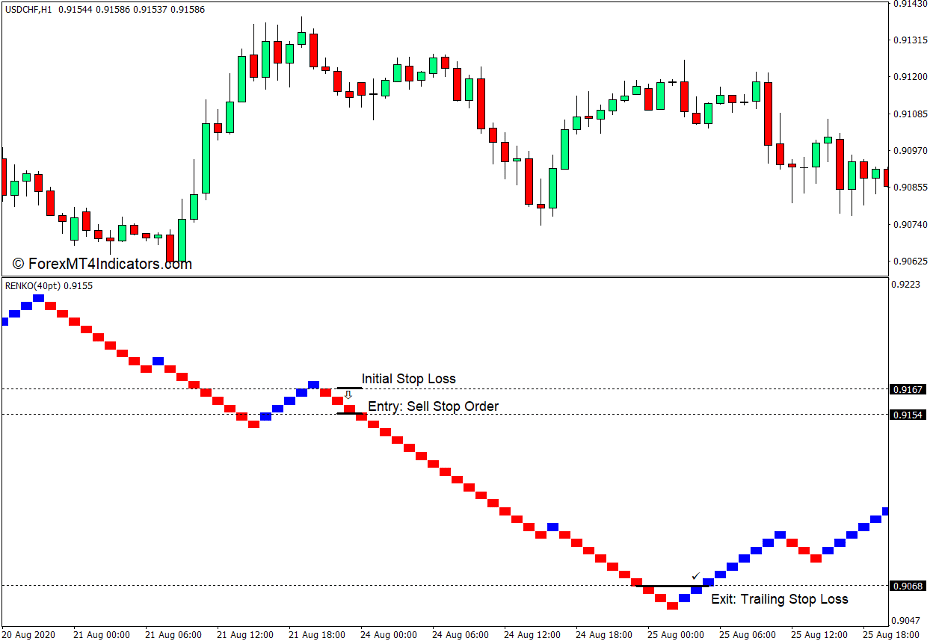
Sell Trade Setup
When to Enter?
Wait for price to reverse down and the Renko Charts to form three red bricks. Determine the price corresponding to the low of the third red brick and set a sell stop order at that price level. Set the stop loss at the price corresponding to the high of the brick three bricks behind the probable entry point.
When to Exit?
Trail the stop loss at the price corresponding to the third brick behind the current Renko Charts brick. Allow price to hit the trailing stop loss while in profit.
Conclusion
There are many ways to trade the Renko Charts. The sample above is just one. Traders can adjust the number of boxes they would use to determine an entry, as well as the number of pips they would set as a basis for the Renko bars.
The Renko Charts indicator is a very useful tool for trading momentum and trends. However, traders need to spend some time getting used to it.
Renko Charts do not coincide with candlesticks. As such, traders would need to constantly look at the Renko Charts to determine whether momentum is reversing or not.
If you are the type of trader who has the discipline to observe price charts for a long time, then the Renko Charts can be a very effective tool for trading trend and momentum reversals.
Recommended MT4/MT5 Brokers
XM Broker
- Free $50 To Start Trading Instantly! (Withdraw-able Profit)
- Deposit Bonus up to $5,000
- Unlimited Loyalty Program
- Award Winning Forex Broker
- Additional Exclusive Bonuses Throughout The Year

>> Sign Up for XM Broker Account here <<
FBS Broker
- Trade 100 Bonus: Free $100 to kickstart your trading journey!
- 100% Deposit Bonus: Double your deposit up to $10,000 and trade with enhanced capital.
- Leverage up to 1:3000: Maximizing potential profits with one of the highest leverage options available.
- ‘Best Customer Service Broker Asia’ Award: Recognized excellence in customer support and service.
- Seasonal Promotions: Enjoy a variety of exclusive bonuses and promotional offers all year round.

>> Sign Up for FBS Broker Account here <<

(Free MT4 Indicators Download)
Click here below to download: