


Trading is not that easy to master. The market could be very fickle. The crowd could change its sentiments and bias every hour. As a result, charts could be very confusing. Price could move erratically every minute. Market noise is prevalent on price charts and any candle or signal could fake you into a trade. The forex market is especially notorious with this. It is the biggest trading market with the most volume being traded on a day to day basis. It would naturally be more volatile than any market.
Although the forex market is very volatile and could sometimes be very difficult to decipher, there are patterns and cycles which could help traders make sense of it all. One of these cycles are its shifting between market contraction and market expansion phases. During a market contraction phase, volatility and volume is usually much lower. This is usually observable on the price chart as sections wherein price is moving in tight ranges. Expansion phases on the other hand are cycles wherein volume is increased and price is moving strongly with huge candles. These two phases would usually go one after the other. Traders could expect that after a tight market contraction phase the market has the potential to move strongly in a certain direction as it enters a market expansion phase.
Momentum breakout strategies are usually based on the concept of looking for tight market contraction phases and waiting for the market to breakout of a tight range as it enters into a market expansion phase. Quantile Bands Momentum Breakout Forex Trading Strategy trades on such market breakouts. It uses two indicators to identify tight market contractions and sudden momentum breakouts.
Quantile Bands
Quantile Bands indicator is a technical indicator based on the theory of probabilities. In statistics quantiles are cut points dividing the range of a probability distribution into contiguous intervals with equal probabilities. This concept of dividing the probable range of price movements is also applied in trading using this indicator.
This indicator plots three lines on the price chart to represent the normal range of price movements. It has a middle line and two outer lines. In a normal ranging market price would usually move within the range bouncing off the outer lines and going back to the middle. However, there are times when price would break out of the bands with strong momentum. Price breaking outside of the bands could indicate a probable momentum breakout scenario.
The middle line of the Quantile Bands indicator could also be used to identify the direction of the trend. Traders could base the trend on where price is in relation to the middle line of the Quantile Bands. If price is staying on the lower portion of the Quantile Bands, then the market is bearish. If price is usually above the midline of the Quantile Bands, then the market is bullish.
Oracle Move Indicator
The Oracle Move indicator, also known as the 100 Pips Momentum Breakout indicator, is a trend following indicator used to help traders identify the short-term momentum trend of the market.
It is based on a pair of modified moving averages that move rather smoothly yet are very responsive to price movements.
The faster moving average line is represented by a blue line, while the slower moving average line is represented by the red line. Trade signals are generated whenever the two moving average lines crossover.
This indicator is typically used as a trend reversal signal. Traders could use the crossing over of the two lines as an indication that price is a about to reverse. It could also be used to help traders filter out trades that are against the short-term momentum. Traders could look at how the moving averages are stacked and trade according to the direction of the trend.
Trading Strategy
Quantile Bands Momentum Breakout Forex Trading Strategy produces trade signals based on a momentum candle closing strongly outside of the Quantile Bands. This is then confirmed by the Oracle Move indicator.
To trade this strategy, we would have to look for sections on the Quantile Bands indicator where the bands are contracted. This would indicate that the market is in a market contraction phase. We then wait for price to close strongly outside of the Quantile Bands line. The same breakout candle should also be a momentum candle characterized by long big bodies.
The breakout signal should then be confirmed based on the short-term momentum as indicated by the Oracle Move indicator.
Indicators:
- Quantile bands
- 100pips Momentum
Preferred Time Frames: 15-minute, 30-minute, 1-hour, 4-hour and daily charts
Currency Pairs: FX majors, minors and crosses
Trading Sessions: Tokyo, London and New York sessions
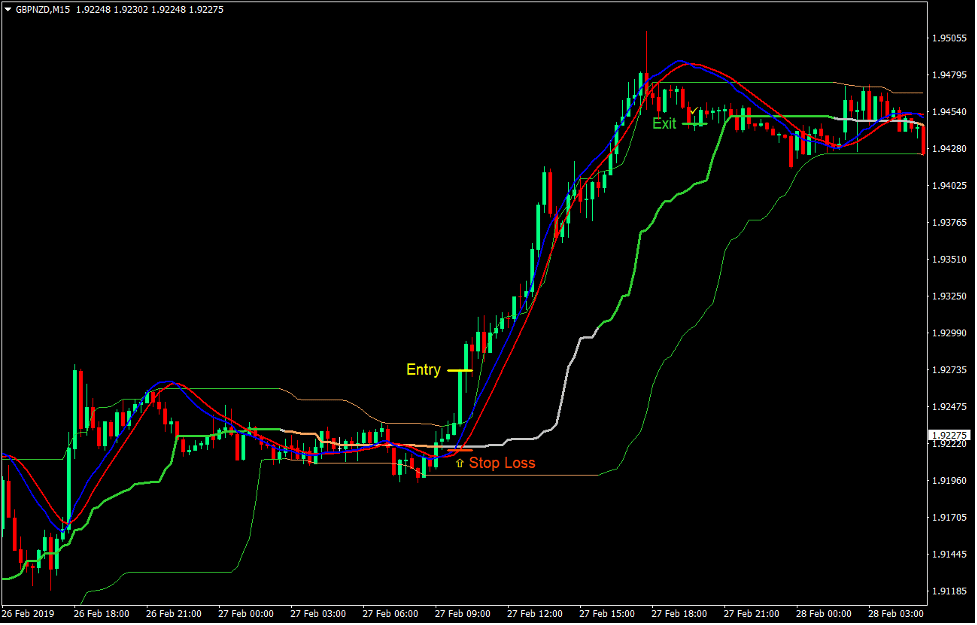
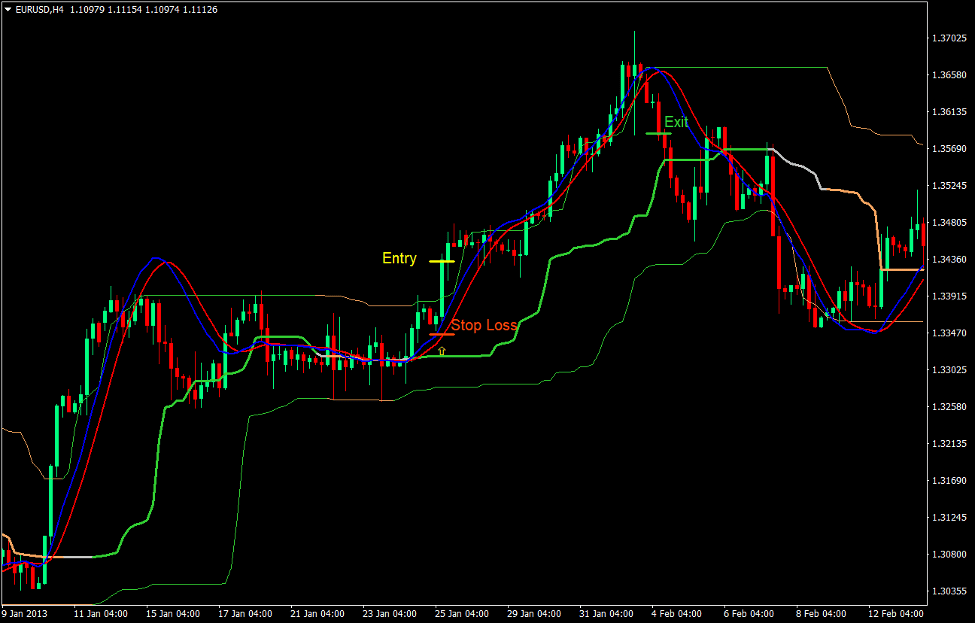
Buy Trade Setup
Entry
- The Quantile Bands should be contracted.
- A bullish momentum candle should close above the upper line of the Quantile Bands.
- The blue line of the Oracle Move indicator should be above the red line.
- Enter a buy order on the confluence of the conditions above.
Stop Loss
- Set the stop loss on the fractal below the entry candle.
Exit
- Close the trade as soon as the blue line of the Oracle Move indicator crosses below the red line.
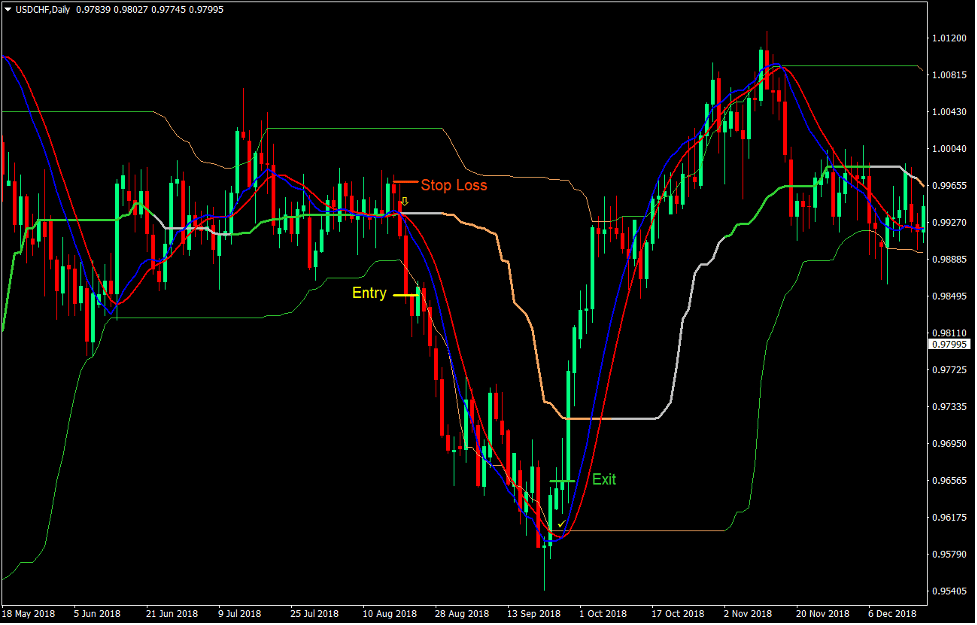
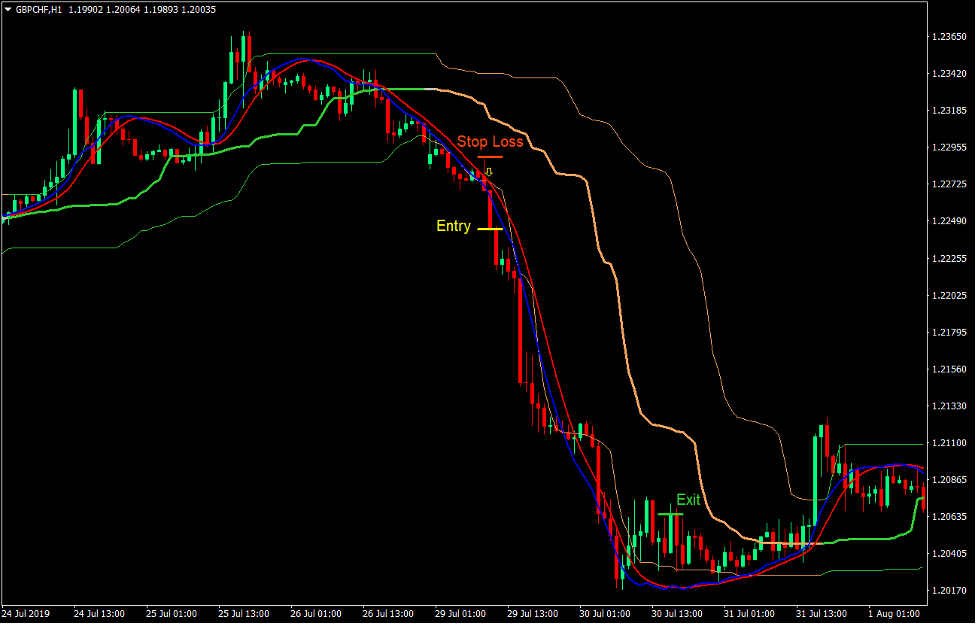
Sell Trade Setup
Entry
- The Quantile Bands should be contracted.
- A bearish momentum candle should close below the lower line of the Quantile Bands.
- The blue line of the Oracle Move indicator should be below the red line.
- Enter a sell order on the confluence of the conditions above.
Stop Loss
- Set the stop loss on the fractal above the entry candle.
Exit
- Close the trade as soon as the blue line of the Oracle Move indicator crosses above the red line.
Conclusion
This trading strategy is an excellent trade entry strategy based on momentum breakouts. Traders could use this strategy to trigger an entry coming from consolidation phases on key areas of support and resistances.
The key to trading this strategy well is in identifying market contraction zones and waiting for breakouts from such zones. Traders could also manually plot the support and resistance lines which price should break out from. This strategy would serve as a confirmation that price has broken out of a contraction phase with strong momentum.
Recommended MT4 Brokers
XM Broker
- Free $50 To Start Trading Instantly! (Withdraw-able Profit)
- Deposit Bonus up to $5,000
- Unlimited Loyalty Program
- Award Winning Forex Broker
- Additional Exclusive Bonuses Throughout The Year

>> Sign Up for XM Broker Account here <<
FBS Broker
- Trade 100 Bonus: Free $100 to kickstart your trading journey!
- 100% Deposit Bonus: Double your deposit up to $10,000 and trade with enhanced capital.
- Leverage up to 1:3000: Maximizing potential profits with one of the highest leverage options available.
- ‘Best Customer Service Broker Asia’ Award: Recognized excellence in customer support and service.
- Seasonal Promotions: Enjoy a variety of exclusive bonuses and promotional offers all year round.

>> Sign Up for FBS Broker Account here <<
Click here below to download: